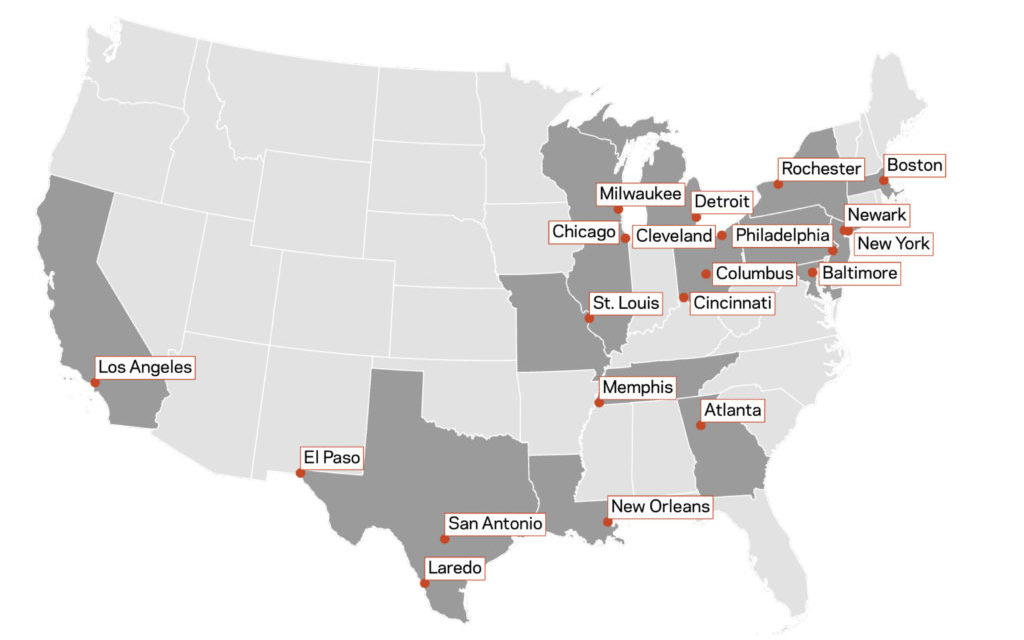
Thumbnail: Memphis’ neighborhood poverty continues to be the leading problem facing the city. The Economic Innovation Group summed it up in graphic terms in its May, 2020 report, The Persistence of Neighborhood Poverty – Examining the power of inertia and the rarity of neighborhood turnaround across U.S. cities. Memphis is one of six cities spotlighted in the report.
**
Here’s the disturbing context:
* From 1980 to 2018, nearly 4,300 neighborhoods, home to 16 million Americans cross the high-poverty threshold (a 30% poverty rate of higher).
* Two thirds of neighborhoods high in poverty in 1980 were still high in poverty in 2018.
* Memphis puts the extent of persistent Black poverty across many American cities in alarming relief.
From the report: Memphis —
It would be easy to forget that the country was until very recently experiencing a record period of economic growth looking at poverty in Memphis. The city’s 2018 poverty rate of 27.8 percent was even three percentage points higher than the year prior, clear evidence that the boom times nationally failed to penetrate the most distressed areas of this particular city. Nationally, Memphis has the second-highest poverty rate among cities with a population over 500,000, Detroit having the highest. In 1980 around one in five people were living below the poverty line in the city; in 2018 around one in four people were. The share of the city’s population living in a high-poverty neighborhood also increased from 30 percent in 1980 to 43 percent in 2018.
Despite being a city where poverty is endemic, Memphis has economic assets that have driven growth in select parts of the city. FedEx recently announced that it will move its headquarters from the suburbs to downtown, just a couple blocks away from a neighborhood where two-thirds of the population lives below the poverty line. Intra-metropolitan inequality is extremely high in Memphis. In 2018, the suburban unemployment rate was 4 percent compared to 10 percent for the city itself.
Thirty-eight tracts in Memphis have experienced persistent poverty since 1980, and another 33 were newly high poverty in 2018. Only two tracts adjacent to downtown turned around from 1980 to 2018. In total, Memphis had 81 tracts experiencing high poverty in 2018, nearly double the number in 1980 and close to half of its total neighborhoods.
Two neighborhoods adjacent to downtown Memphis, one to the south and one to the north, flipped from high poverty to low poverty between 1980 and 2018. Every other neighborhood close to the center of the city remained high poverty, as newly poor neighborhoods formed further from downtown. North Memphis, which has been hit hard by several factory closures over the past couple decades, has the broadest swath of new high-poverty tracts.
Black residents continue to be disproportionately impacted by poverty in Memphis. The Black share of the population living in the average high-poverty neighborhood dropped slightly from 85 percent in 1980 to 82 percent in 2018, largely due to an influx of Hispanics, whose share grew from 1 percent in 1980 to 7 percent in 2018. The share of non-Hispanic whites living in these neighborhoods actually declined from 13 percent to 7 percent, bucking national trends.
Nearly one-quarter of all homes stand vacant in the city’s high-poverty neighborhoods, where two-thirds of renters are rent-burdened (paying more than 30 percent of their income towards housing). Prime age unemployment in high-poverty neighborhoods is nearly double the rate of the rest of the city. Alarmingly, the population living in highpoverty neighborhoods has increased by 43 percent since 1980, while the rest of the city’s population fell by 23 percent.
| High-poverty tracts | All other tracts | ||
| Income | Median household income | $25,000 | $54,000 |
| Demographics | Population, 1980 | 195,000 | 464,000 |
| Population, 2018 | 275,000 | 359,000 | |
| % population change, 1980-2018 | 41% | -23% | |
| Population below poverty line 1980 | 85,000 | 54,000 | |
| Population below poverty line 2018 | 112,000 | 57,000 | |
| % poverty population change, 1980-2018 | 32% | 6% | |
| Racial/ethnic profile | |||
| % non-Hispanic White | 9% | 39% | |
| % Hispanic | 7% | 6% | |
| % Black | 82% | 52% | |
| % Foreign born | 5% | 6% | |
| Education | % Adults without a high school diploma | 23% | 10% |
| % Adults with a bachelor’s degree or higher | 12% | 35% | |
| Labor market | % prime age (25-54) out of work | 37% | 20% |
| Housing | % rent-burdened | 66% | 51% |
| Median value for owner-occupied units | $58,000 | $149,000 | |
| Vacancy rate | 22% | 12% | |
| Health | Average life expectancy, 2015 | 71 | 76 |
| Uninsured | 19% | 12% | |
| Shares represent averages of tracts in each cohort
Rent-burdened reflects share of renter occupied households that spend 30%+ of their household income on housing Data is for 2018 unless otherwise noted Source: Economic Innovation Group analysis of CDC data, U.S. Census data and American Community Survey 5-Year estimates |
|||

