For reasons known only to the Memphis Shelby Crime Commission and the University of Memphis Public Safety Institute, which are opposite sides of the same coin, the trend lines on its regular crime trends reports do not track year-to-year rates but instead, benchmarks the rate every five years.
As MLK50 founder Wendi Thomas pointed out recently: “Line Chart 101: The horizontal (x)-axis intervals should be regular intervals. If you wanted to show how crime increased over a period of time, you could measure it year-over-year (one-year intervals), or quarter-over-quarter, but it would be misleading to mix intervals.”
That said, if five-year intervals are the best that the Crime Commission/Public Safety Institute will provide for major violent crimes, it’s useful to correlate them with these events:
2006 – Willie W. Herenton is Memphis Mayor
2011 – A C Wharton is Memphis Mayor
2012 – Amy Weirich is elected Shelby County Attorney General
2016 – Jim Strickland is elected mayor on the strength of his promise to reduce crime.
Bill Gibbons becomes head of the University of Memphis Public Safety
Institute/Memphis Shelby Crime Commission
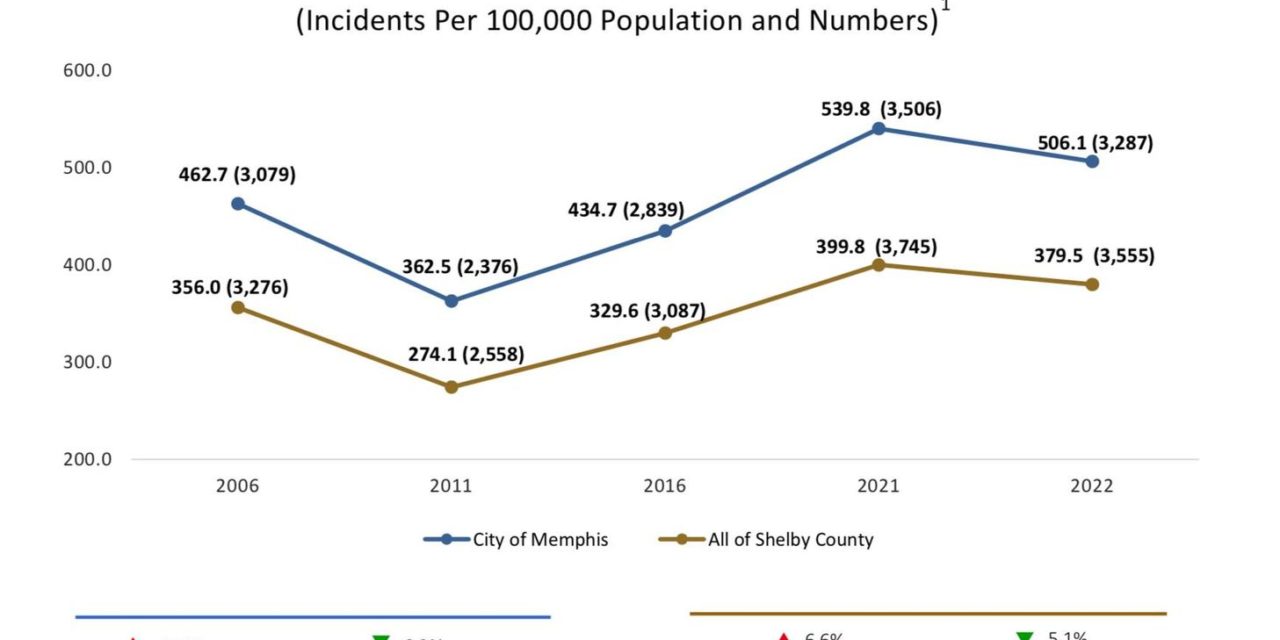
Major Violent Crime Rate (incidents per 100,000 population – First Quarter):
462.7 – 2006
362.5 – 2011
434.7 – 2016 – Strickland elected mayor; Gibbons becomes head of Crime Commission
539.8 – 2021
506.1 – 2022
Number of major violent crimes:
3,079 – 2006
2,376 – 2011
2.839 – 2016
3,506 – 2021
3,287 – 2022
Increase/decrease of crime rate compared to previous reporting year:
-21.6 % – 2011
+16.6% – 2016
+24.2% – 2021
– 4% – 2022
Murder Rate:
4.8 – 2006
3.8 – 2011
7.7 – 2016
9.2 – 2021
9.2 – 2022
92.1% increase from 2005-2022
142.2% increase from 2011-2022
* Major violent crime: murders, rapes, robberies, and aggravated assaults.

