Between 2014-2018, the Memphis MSA population grew by about 15,000 people, according to U.S. Census Bureau.
What makes this interesting is how much churn is produced with in-migration and out-migration.
For example, in those years, 3,496 people moved from Nashville to Memphis. However, 3,724 people moved in the opposite direction, which meant that Nashville had a net increase of 228 people.
In this same period of time, people moving to and from Memphis involved hundreds of U.S. MSAs. Some relate to college towns, “hot cities,” military bases, and others reflect the economic decisions of companies moving to Memphis and others moving away. Some defy understanding.
The following is a random list of metro areas and whether the Memphis MSA won or lost in the battle for more people.
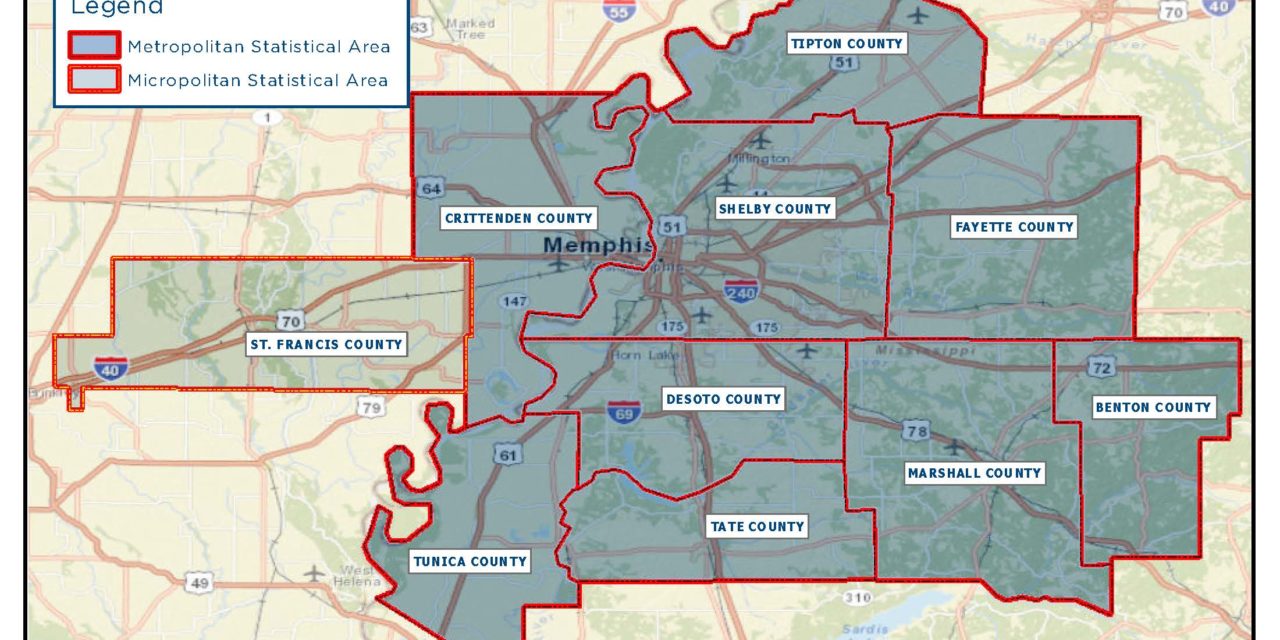
Keep in mind these numbers are not for Memphis or Shelby County, but for the 10 counties in the MSA.
In the list below, the number of people moving in each direction is netted out. A minus number indicates that the Memphis MSA lost population. If the number has a plus sign, it means Memphis attracted more people than it lost.
Atlanta -673
Baltimore -163
Birmingham +96
Charleston -220
Chattanooga +116
Chicago +577
Cincinnati -485
Dallas -878
Dayton -201
Denver -299
Detroit -288
Fayetteville -130
Fort Wayne -180
Greensboro NC +381
Gulfport/Biloxi -338
Hattiesburg -350
Houston -650
Jackson MS -199
Jackson TN +297
Jacksonville -297
Kansas City +149
Lexington KY -231
Los Angeles +207
Louisville +187
Miami +433
Minneapolis -168
Nashville -228
New York City -133
Orlando -301
Panama City -131
Pensacola -131
Philadelphia -105
Providence RI -171
Salt Lake City +165
San Diego +347
Seattle -212
Sioux Falls +153
Tulsa -160
Tuscaloosa -206
Washington DC -245
Winston-Salem -320
**
Join us at the Smart City Memphis Facebook page for daily articles, reports, and commentaries relevant to Memphis.


