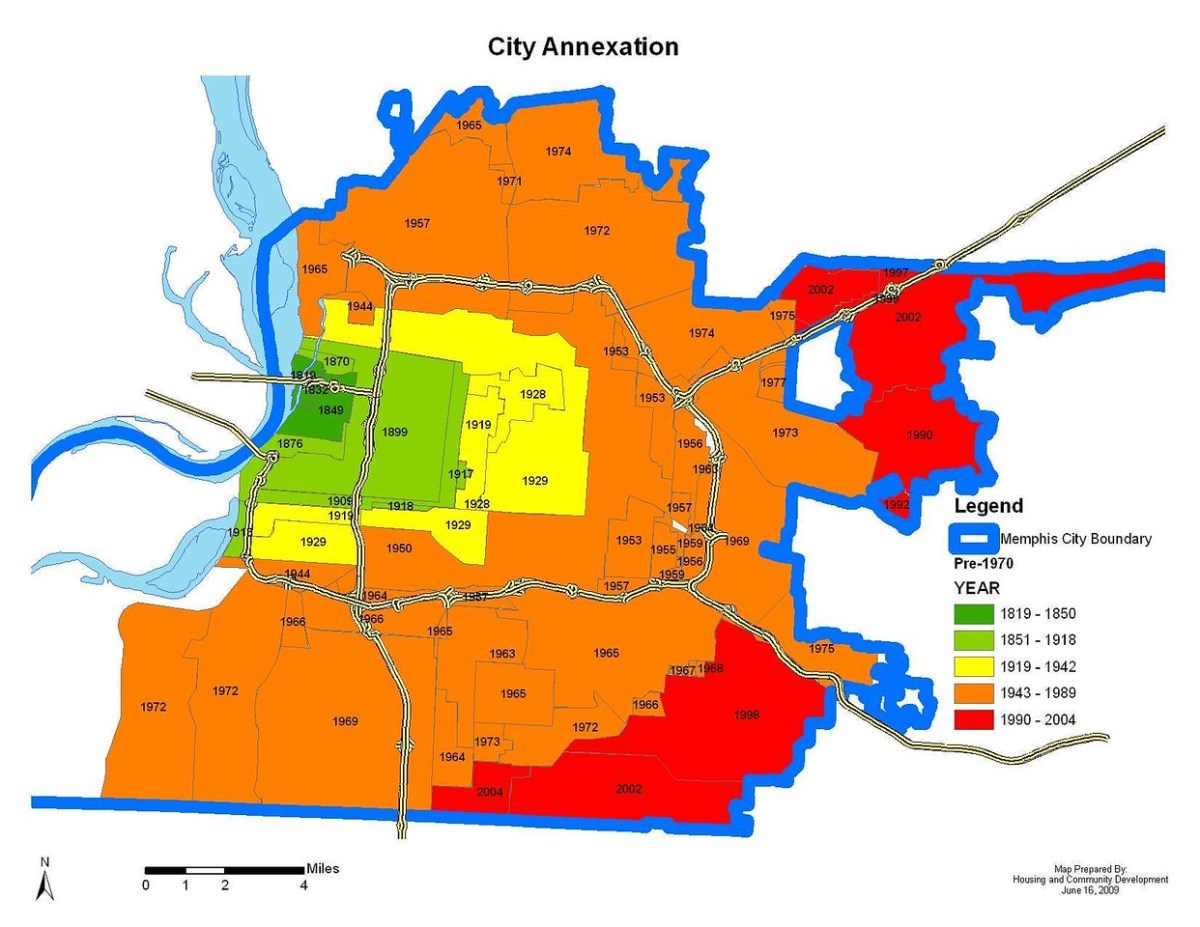
Memphis’ aggressive annexation substantially increased the land area of the city from 1960 to this decade while almost halving density, driving up the cost of public services for city government. The following is the current density for Memphis and other cities followed by Memphis population and land areas over time.
From 1960 to the present, the land area of Memphis climbed from 129 to 315 square miles, as the density per square mile fell from 3,857 to 2,072 people.
Current Population Density – population per square mile
2,072 – Memphis
7,088 – Minneapolis
6,188 – Milwaukee
5,521 – Pittsburgh
5,144 – Detroit
3,923 – Denver
3,810 – Cincinnati
3,624 – Columbus, Ohio
3,517 – Dallas
3,515 – Richmond
3,154 – Atlanta
2,826 – Raleigh
2,880 – San Antonio
2,653 – Austin
2,457 – Charlotte
2,270 – Indianapolis
2,053 – Memphis
1,992 – Tulsa
1,837 – Louisville
1,459 – Kansas City
1,453 – Birmingham
1,265 – Nashville/Davidson County
956 – Oklahoma City
Memphis Population by Decades
2016 – 652,717
2010 – 646,889
2000 – 650,100
1990 – 610,337
1980 – 646,174
1970 – 623, 988
1960 – 497,524
1950 – 396,000
Memphis Land Area by Decades
2016 – 315.1 square miles
2000 – 279.3 square miles
1980 – 264.1 square miles
1970 – 216.4 square miles
1960 – 129.0 square miles
1950 – 104.2 square miles
Land Area for other cities
386 square miles – Dallas
319 square miles – Kansas City
315 square miles – Memphis
305 square miles – Austin
234 square miles – Chicago
149 square miles – Birmingham
143 square miles – Detroit
143 square miles – Chattanooga
143 square miles – Philadelphia
142 square miles – Seattle
134 square miles – Atlanta
117 square miles – Little Rock
110 square miles – Salt Lake City
98 square miles – Knoxville
97 square miles – Milwaukee
92 square miles – Baltimore
80 square miles – Cincinnati
***
Join us at the Smart City Memphis Facebook page for daily articles, reports, and commentaries that are relevant to Memphis.