Brookings Institution’s Metro Monitor is a set of objective metrics aimed at guiding the efforts of leaders to advance regional economies. It tracks the economic performance of the nation’s 100 largest metro areas on growth, prosperity, and inclusion.
Brookings said: “These represent the pillars of successful economic development which should encourage robust long-run growth (growth) by improving the productivity of individuals and firms in order to raise local standards of living (prosperity) for all people (inclusion).”
Its 2017 report, in almost every indicator, paints the portrait of a lethargic regional economy, the squandering of human capital, inert wage growth, and losing ground in the race for economic success. Metro Monitor’s indicators also concluded that the Memphis metro is underperforming when actual jobs growth is compared to expected jobs growth based on industrial structure.
This report is but the latest reason for a call to arms, and as Pogo said, we have met the enemy and it is us.
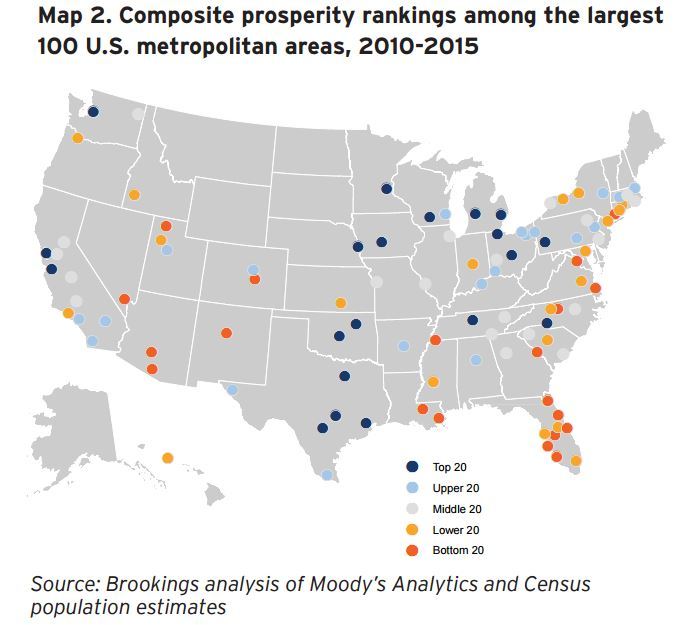
Here’s how the Memphis metropolitan area stacks up in the ranking of 100 largest regions:
2010 – 2015
#85 – Growth
#81 – Prosperity
#50 – Inclusion
2005 – 2015
#78 – Growth
#75 – Prosperity
#52 – Inclusion
Growth:
Growth indicators measure change in the size of a metropolitan area economy and its level of entrepreneurial activity. Growth and entrepreneurship create new opportunities for individuals and can help a metropolitan economy become more efficient. The Metro Monitor measures growth in gross metropolitan product, number of jobs, and number of jobs at young firms.
Between 2010 and 2015, Memphis MSA jobs increased +5.8% (#75); the gross metropolitan product increased +2.8% (#84); and jobs at young firms declined -4.5% (#70).
The difference between the actual jobs growth and the expected jobs growth, which indicates whether the metro is overperforming or underperforming, was -3.7%. For the period between 2005 and 2015, the difference was -5.8%.
Prosperity:
Prosperity captures changes in the average wealth and income produced by an economy. When a metropolitan area grows by increasing the productivity of its workers, through innovation or by upgrading workers’ skills, for example, the value of those workers’ labor rises. As the value of labor rises, so can wages. Increases in productivity and wages are what ultimately improve living standards for workers and families and the competitiveness of metropolitan economies.
Memphis ranks 81st in overall prosperity between 2010-2015.
Productivity was -2.8% (#78), standard of living +1.5% (#73), and average annual wage +1.7% (#85).
Inclusion:
Inclusion indicators measure how the benefits of growth and prosperity in a metropolitan economy—specifically, changes in employment and income—are distributed among individuals. Inclusive growth enables more people to invest in their skills and to purchase more goods and services. Thus, inclusive growth can increase human capital and raise aggregate demand, boosting prosperity and growth. Ensuring that all people can contribute to and benefit from growth and prosperity also helps sustain widespread support for the policies on which growth and prosperity depend. Memphis is #50 in inclusion for 2010-2015.
The employment rate increased 4.3% (#49); median wage declined -3.6% (#83), and relative poverty declined -6.1% (#28)
Median Wage
The percent change in median wage by race and education:
+1.8% – White
-9.4% – Black
+17.5% – Hispanic
-6.9% – Asian
+50.3% – Other
0.0% – High School
-7.6% – Some college or AA
-6.9% – BA or above
Relative Poverty
-12.2% – White
+0.5% – Black
-25.9% – Hispanic
-2.3% – Asian
-35.6% – Other
-6.3% – High school
-3.6% – Some college of AA
+1.2% – BA or above
**
Join us at the Smart City Memphis Facebook page for daily articles, reports, and commentaries relevant to Memphis.


Is there ever any positive news about Memphis? In every single poll, survey, ranking out there Memphis comes in way behind.
This city and its region have lost its mojo and continue to fall way behind. It’s not inaccurate to say that we are a city in steep decline and that’s very disturbing.
Dear anonymous, If you love Memphis, you have to take pleasure in our local victories, like The crosstown Concourse. Reading Smart City regularly will bring you down because this city ranks poorly in most surveys. Unfortunately, the people that caused this don’t read smart city and frankly couldn’t care less. Crime is an epic disaster for this community. The damage done in lost revenues, jobs, business, and prestige is huge. I worry that it can’t be controlled, even with 500 more police officers we can’t afford.
Dear Homeboy.
So just exactly who are “the people that caused this”?
There is regularly positive news about Memphis. We wrote about many of these milestones for thrillist last year and reposted it here. The thing is that we have to celebrate what we are doing that is important but we have to develop a real sense of urgency to change the underlying structural issues. An economy that overemphasizes low-wage, low-skill jobs is not one that portends great success for the future. We have to develop a vision, an actionable plan to achieve it, and then set out with the 20-year commitment it will take to realize it.
Yes there may occasionally be some positive news about Memphis, but the good news reports are increasingly rare. Changing the fundamentals and structural problems is almost impossible in today’s city and county. It would take generations to rebuild the city’s shattered economic fabric and I’m afraid that’s just not going to happen in a city with so many serious issues and that has already fallen so far behind. Leaders can continue to develop “visions and action plans” for the next 20+ years, but I’m skeptical that much is ever going to improve in Memphis. Unfortunately that’s the engrained way things go here. Memphis is caught in a downward spiral.
The jobs market is bad. Only low paid service jobs and warehouse type jobs. Even administrative and white collar jobs all around the area pay real pathetic salary.