From Atlantic Cities:
When we think about borders, we tend to think of administrative boundaries. Those demarcating lines, often grown out of rivers and mountain ranges or diplomatic quirks, govern our daily lives, and that’s doubly so if we live near a neighboring country or state.
We know that these boundaries are on some level unnatural. Driving around Kansas City, where I live, makes this abundantly clear. Gas price differences aside, it can be difficult to tell which state you’re in, Missouri or Kansas, and the small street of State Line Road does nothing to make it clearer.

But are there more organic borders, brought to life by our own actions and activities? I recently set out, along with a team from MIT and AT&T, to see if I could find an answer. Previously, members of our group had collaborated to use mobile phone call and text message records to determine how tightly connected different counties are to each other. But communication is far from the only way in which we are connected or separated. We can be connected based on where we move, how we speak, and even what sports teams we root for.
So our research team, consisting of DeDe Paul of AT&T, Vincent Blondel of Belgium’s Université catholique de Louvain, IBM’s Dominik Dahlem*, and myself, set out to understand how a variety of cultural and social properties create borders, and whether or not these borders actually overlap. Are there in fact natural boundaries to the borders that we create as social creatures?
Let’s first examine the different borders we can define. We first have communication, from cell phone data. The map below, based on aggregated phone calls between counties, makes use of an algorithm we developed that detects communities within networks. The result is a visualization of highly connected counties, grouped together by color. These clusters of connected places sometimes coincide with political boundaries, but in many other cases do not.

Historically, communication and mobility were closely tied together; you could only interact directly with people in person. But with the advent of the telephone and the Internet, these two parts of human behavior have become disentangled. So, does mobility affect the borders we find?
Using data from IRS migration records—where people relocate to—we constructed a similar map, but this time based on mobility. In this case, we connected and grouped counties based on where people moved, rather than to whom they spoke. Instead of showing the different groupings, we have this time highlighted the borders between these regions.

We next combined the two maps, weighting the borders based on how often they are found to occur in both mobility and communication maps.

What we found is that, for the most part, there is a great deal of overlap between communication and mobility. This is especially clear in the South, where the border between Mississippi and Arkansas is present for all of the data. In other words, people in Mississippi (or Arkansas) primarily interact with others in their own state, and even tend to move only within the state. Despite all the technology at our disposal, in many ways we are still products of place.
So if there’s still a strong relationship between who we communicate with and the borders of where we live, does that also hold true for the words we use?
One of the clearest regional differences in the U.S. can found by tracking the words people use to refer to soft drinks, which is in fact the map you saw at the top of this story. Pop or soda, or even Coke, these small linguistic differences are not as small as we might think. While “soda” commands the Northeast and West Coast (green) and “pop” is in between (black), “Coke” reigns in the south (turquoise). These small distinctions can often act as touchstones for larger cultural differences.

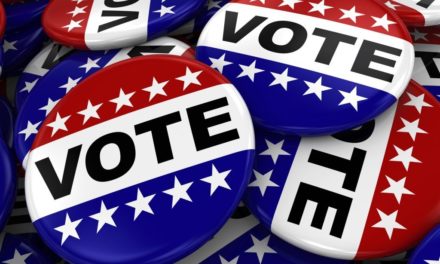
We can also look at how different counties voted in the last presidential election (blue is Democratic and green is Republican, with Purple as missing data).

And we can even do sports! Below is a map of baseball blackout regions, the parts of the country where a team’s games are considered a local market and are subject to certain broadcasting conditions.

Map courtesy of Wikimedia Commons.
So, between language, sports, mobility, communication, and even politics, are there any natural borders? Or does our complex nature make the boundaries that separate us also completely messy?

We combined several maps into one to see if any patterns emerged. At first glance, the result seems incredibly messy, although there are certain borders that do jump out (such as the Mississippi River, for example). But when we zoomed in on smaller regions, it was easier to pick out a few natural borders.
For example, New England is incontrovertibly a single region, connected by interaction, mobility, and culture. Similarly, certain states such as Texas and Kansas are their own distinctive regions.
On the other hand, New Jersey and California have a distinct bisection that divides them, though not always in the same way or place. For example, California is divided into Northern and Southern California, when we look at voice phone calls:

But it’s divided into three sections, when we use digital text message records:

Similarly, we can do the same thing using sports affiliations to understand where Red Sox Nation ends and Yankees Nation begins. This classic New York Times graphic shows how Connecticut is bisected.

While we as humans are incredibly complicated organisms, there are a few simple rules to how we behave. We sort ourselves based on cultural similarities, and these in turn are related to how we choose to move from place to place, and even with whom we communicate. A lot of these boundaries are porous and messy, allowing for a rich diversity of cultural flow. But knowing how we interact as part of a complex society, instead of only looking at political borders, can explain a lot more than we might have imagined.
*An earlier version of this story neglected to acknowledge the contributions of Dominik Dahlem to this project! Our apologies for the omission.

Samuel Arbesman is a senior scholar at the Kauffman Foundation and a fellow at the Institute for Quantitative Social Science at Harvard University. All posts »

