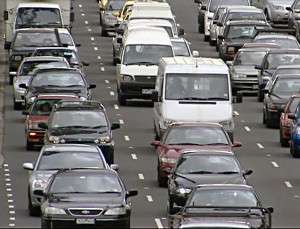
We couldn’t help but think of I-269 and all the Chamber types clamoring for it when we read a recent report debunking the standards used to justify billions of dollars in new roads.
According to Driven Apart: How sprawl is lengthening our commutes and why misleading mobility measures are making things worse, the report by CEOs for Cities and the Rockefeller Foundation, more compact cities are the answer to traffic delays and that current mobility measurements overestimate the cost of congestion by $49 billion. An accompanying technical report explains the mistakes in the methodology that create reports used by the asphalt lobby for more and more lanes of highways.
Information on the report:
While peak hour travel is a perennial headache for many Americans — peak hour travel times average 200 hours a year in large metropolitan areas — some cities have managed to achieve shorter travel times and actually reduce the peak hour travel times. The key is that some metropolitan areas have land use patterns and transportation systems that enable their residents to take shorter trips and minimize the burden of peak hour travel.
That’s not the conclusion promoted by years of highway-oriented transportation research. The Urban Mobility Report (UMR) produced annually by the Texas Transportation Institute and widely used to gauge metropolitan traffic problems has overlooked the role that variations in travel distances play in driving urban transportation problems.
More to It
This report offers a new view of urban transportation performance. It explores the key role that land use and variations in travel distances play in determining how long Americans spend in peak hour travel.
• Travelers in some cities – those with more compact development patterns – tend to spend less time in peak hour traffic because they don’t have to travel as far.
• If every one of the top 50 metro areas achieved the same level of peak hour travel distances as the best performing cities, their residents would drive about 40 billion fewer miles per year and use two billion fewer gallons of fuel, at a savings of $31 billion annually.
• In the best performing cities the typical traveler spends 40 fewer hours per year in peak hour travel than the average American because of the shorter distances they have to travel.
In the best performing cities—those that have achieved the shortest peak hour travel distances – such as Chicago, Portland and Sacramento, the typical traveler spends 40 fewer hours per year in peak hour travel than the average American. In contrast, in the most sprawling metropolitan areas, such as Nashville, Indianapolis and Raleigh, the average resident spends as much as 240 hours per year in peak period travel because travel distances are so much greater. These data suggest that reducing average trip lengths is a key to reducing the burden of peak period travel.
Better Tools
The central analytical tool in the Urban Mobility Report is the Travel Time Index (TTI), which is the ratio of average peak hour travel times to average free flow travel times.
On its face, the Travel Time Index seems like a reasonable way to compare city transportation systems. And if all cities had similar land use patterns and densities and had the same average trip lengths, then the TTI would be a fair measure. But city land use patterns vary substantially, and as a result the Travel Time Index conceals major differences in urban transportation between different cities.
The surprising analysis by Joseph Cortright, senior policy advisor for CEOs for Cities, says the solution to this problem has much more to do with how we build our cities than how we build our roads.
The report takes a new look at what’s really causing traffic congestion in America. The conclusions are far different than those of the UMR, which has long been used to measure traffic congestion. “This analysis, once again, shows that many of the assumptions driving big investments of taxpayer dollars that shape our communities are outdated,” said CEOs for Cities President and CEO Carol Coletta. “Driven Apart adds to the growing body of evidence that shows compact development that puts many destinations close at hand has unexpected benefits — in this case, less time spent in traffic requiring less spending on highways. If we heed its findings, we’ll save time and money.”
The Long Road
Driven Apart ranks how long residents in the nation’s largest 51 metropolitan areas spend in peak hour traffic, and in some cases the rankings are almost the opposite of those listed in the 2009 Urban Mobility Report. For instance, the UMR depicts Chicago as having some of the worst travel delays, when it actually has the shortest time spent in peak hour traffic of any major US metro area. In contrast, Nashville jumped from 31st to first on the list of those with the longest peak travel times.
While peak hour travel times average 200 hours a year in large metropolitan areas, Driven Apart proves that some cities have managed to achieve shorter travel times and actually reduce the peak hour travel times. The key is that some metropolitan areas such as Chicago, Portland and Sacramento have land use patterns and transportation systems that enable their residents to take shorter trips and minimize the burden of peak hour travel. If every one of the top 50 metros followed suit with Chicago and other higher performing cities, their residents would drive about 40 billion fewer miles per year and use two billion fewer gallons of fuel, for a cost savings of $31 billion annually.
“It is more critical than ever that the US’s transportation investments be guided by accurate data – especially during these difficult financial times,” said Rockefeller Foundation Associate Director Benjamin de la Peña. “Transportation costs are often the second highest expense for working Americans, and we must make sure we are providing more transportation options to help them stretch their budgets.”
A close examination shows that the UMR has a number of major flaws that misstate and exaggerate the effects of congestion, particularly the Travel Time Index (TTI). TTI is the ratio of average peak hour travel times to average free flow travel times. Furthermore, for the 51 metropolitan areas analyzed in Driven Apart, the UMR overstates the cost of congestion by about $49 billion. Because this methodology does not take into account travel distances, it universally rewards cities that are spread out as opposed to compact urban areas.
“When it comes to understanding the nature of our urban transportation problems and how best to solve them, the UMR generates more heat than light, said Cortright. The Travel Time Index is a poor guide to making investments, and its time for a new perspective that highlights how we can make progress in reducing travel times through a variety of means.”
Better Measurements Needed
Contrary to the UMR findings, Driven Apart says that many metropolitan areas have actually seen reductions in average peak hour travel times because residents are now traveling shorter distances, reflecting land use patterns and personal choices about where to live and work. Rather than simply raising alarm about frustrating traffic delays, Driven Apart suggests new metrics that focus on trip distances and total travel times—two statistics not reported in the UMR— because they point to a broader and more powerful set of public policy options for dealing with urban transportation problems. The report recommends a new system for measuring urban transportation performance that includes emphasizing accessibility and focusing on measures of land uses, trip lengths and mode choices as well as travel speeds.
“The key role of sprawling development patterns in driving peak period traffic and the limitations of the Urban Mobility Report underscore the need for a much improved system for measuring and comparing the performance of urban transportation systems. Such a system should incorporate better and more precise data about speeds but also specifically track travel distances and land use patterns,” said Cortright.
“As someone who has long believed in the impact of land uses and community design on travel behavior, I am pleased to see this thoughtful critique of our inadequate approach to measuring traffic congestion. This report should be required reading for anyone interested in reducing the time Americans spend stuck in traffic and improving the livability of our communities,” said Congressman Earl Blumenauer. “Today’s fiscally-constrained environment demands that we get the most bang out of our transportation buck. Doing so means that we need complete and accurate measures of how the transportation system is functioning and what those measures mean for investments and operations going forward. Driven Apart helps fill a critical gap in that understanding,” said Robert Puentes, Senior Fellow, Metropolitan Policy Program,The Brookings Institution.
“Conventional urban transportation performance indicators, such as the Texas Transportation Institute’s Travel Time Index, tend to misdiagnose traffic congestion problems by only considering motor vehicle traffic delays while ignoring other factors that affect urban accessibility such as land use patterns that affect the distances people and freight must travel to reach destinations (and therefore average trip lengths), and the quality of alternative modes, particularly grade separated public transit services. This report explores these issues and identifies better urban transport evaluation methods,” said Todd Litman, Victoria Transport Institute.
“Cortright’s study provides a much-needed service by exposing the limited nature of the economic value that too many highway planners assign to higher traffic speeds. Even on the questionable basis used by TTI to assign value to congestion mitigation, the estimated potential savings from higher average speeds is a small fraction of the reduction in the cost of living that results from needing to drive fewer cars and driving them less, which results from compactness and increased convenience and accessibility, both in central cities and in suburbs, period,” Scott Bernstein, President, Center for Neighborhood Technology


