By Gregory M. Blumenthal (greg@gmbs-consulting.com)
Many people have recently asked me the same question: What are the demographics of voter turnout in Shelby County? Rather than answer them all individually, I have decided to write the answer once, and publish it somewhere everyone can read it at their leisure. Thank you, Tom Jones, for the soapbox.
Fortunately, current practice in the United States is not to have any personally or racially identifying marks on our ballots. This does, however, have the side effect that the demographics of voter turnout cannot be described precisely. Fortunately or unfortunately, the strongly segregated nature of Shelby County permits some relatively solid estimates. The 2022 general election for the Shelby County District Attorney will be used as the benchmark of voter participation, as more votes were registered in that race than in any other in that election.
| Office | Votes |
| District Attorney General | 135828 |
| County Mayor | 135571 |
| County Clerk | 133860 |
| Assessor of Property | 133468 |
| County Trustee | 132188 |
| Register of Deeds | 132001 |
| Circuit Court Clerk | 131258 |
| Criminal Court Clerk | 131121 |
| Probate Court Clerk | 130827 |
| Sheriff | 126794 |
It would be ideal to base calculations upon the demographics of the precincts. However, they were all redrawn after the 2020 Census, and demographic statistics by precinct have not been released since then. Therefore, these calculations will be based upon the County Commission districts, which are still highly racially segregated. These are the populations of the new districts based upon the 2020 Census.
| Population Over 18 | % Over 18 | |||||
| District | Total | White | Black | White | Black | Other |
| 01 | 54,824 | 31,352 | 16,527 | 57% | 30% | 13% |
| 02 | 55,113 | 38,991 | 7,304 | 71% | 13% | 16% |
| 03 | 54,300 | 38,807 | 9,770 | 71% | 18% | 11% |
| 04 | 57,434 | 44,294 | 7,715 | 77% | 13% | 9% |
| 05 | 55,395 | 21,591 | 24,594 | 39% | 44% | 17% |
| 06 | 49,511 | 9,214 | 33,788 | 19% | 68% | 13% |
| 07 | 51,374 | 11,635 | 33,280 | 23% | 65% | 13% |
| 08 | 57,182 | 15,479 | 36,530 | 27% | 64% | 9% |
| 09 | 52,779 | 1,241 | 49,796 | 2% | 94% | 3% |
| 10 | 53,761 | 4,600 | 43,585 | 9% | 81% | 10% |
| 11 | 50,884 | 3,591 | 39,024 | 7% | 77% | 16% |
| 12 | 53,718 | 7,807 | 39,347 | 15% | 73% | 12% |
| 13 | 59,788 | 38,429 | 12,623 | 64% | 21% | 15% |
| Total | 706,063 | 267,031 | 353,883 | 38% | 50% | 12% |
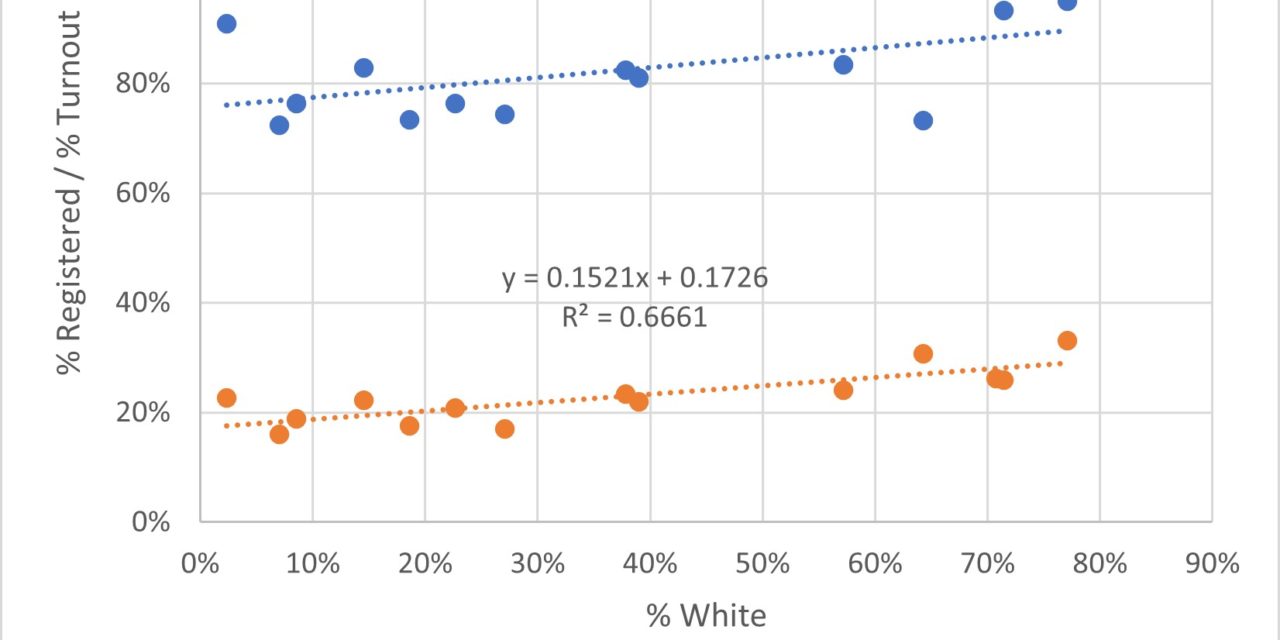
These are the numbers of people who registered to vote in each district, voted in the 2020 general election, the percent of population over 18 who registered to vote, and the percent of registered voters who voted.
| District | Registered | Votes | % Registered | % Turnout |
| 01 | 45,760 | 11,044 | 83% | 24% |
| 02 | 53,818 | 14,112 | 98% | 26% |
| 03 | 50,620 | 13,132 | 93% | 26% |
| 04 | 54,594 | 18,078 | 95% | 33% |
| 05 | 44,899 | 9,833 | 81% | 22% |
| 06 | 36,332 | 6,381 | 73% | 18% |
| 07 | 39,221 | 8,183 | 76% | 21% |
| 08 | 42,542 | 7,262 | 74% | 17% |
| 09 | 47,941 | 10,842 | 91% | 23% |
| 10 | 41,017 | 7,722 | 76% | 19% |
| 11 | 36,867 | 5,924 | 72% | 16% |
| 12 | 44,476 | 9,900 | 83% | 22% |
| 13 | 43,765 | 13,415 | 73% | 31% |
| Grand Total | 581,852 | 135,828 | 82% | 23% |
One statement that is often made is that, due to disproportionate contact with the criminal justice system, Black citizens are less likely to be registered to vote. Districts with a higher percentage of White adults do have a higher percentage of their adults registered to vote. However, these Whiter districts are even more likely to have registered voters who actually turn out to vote.
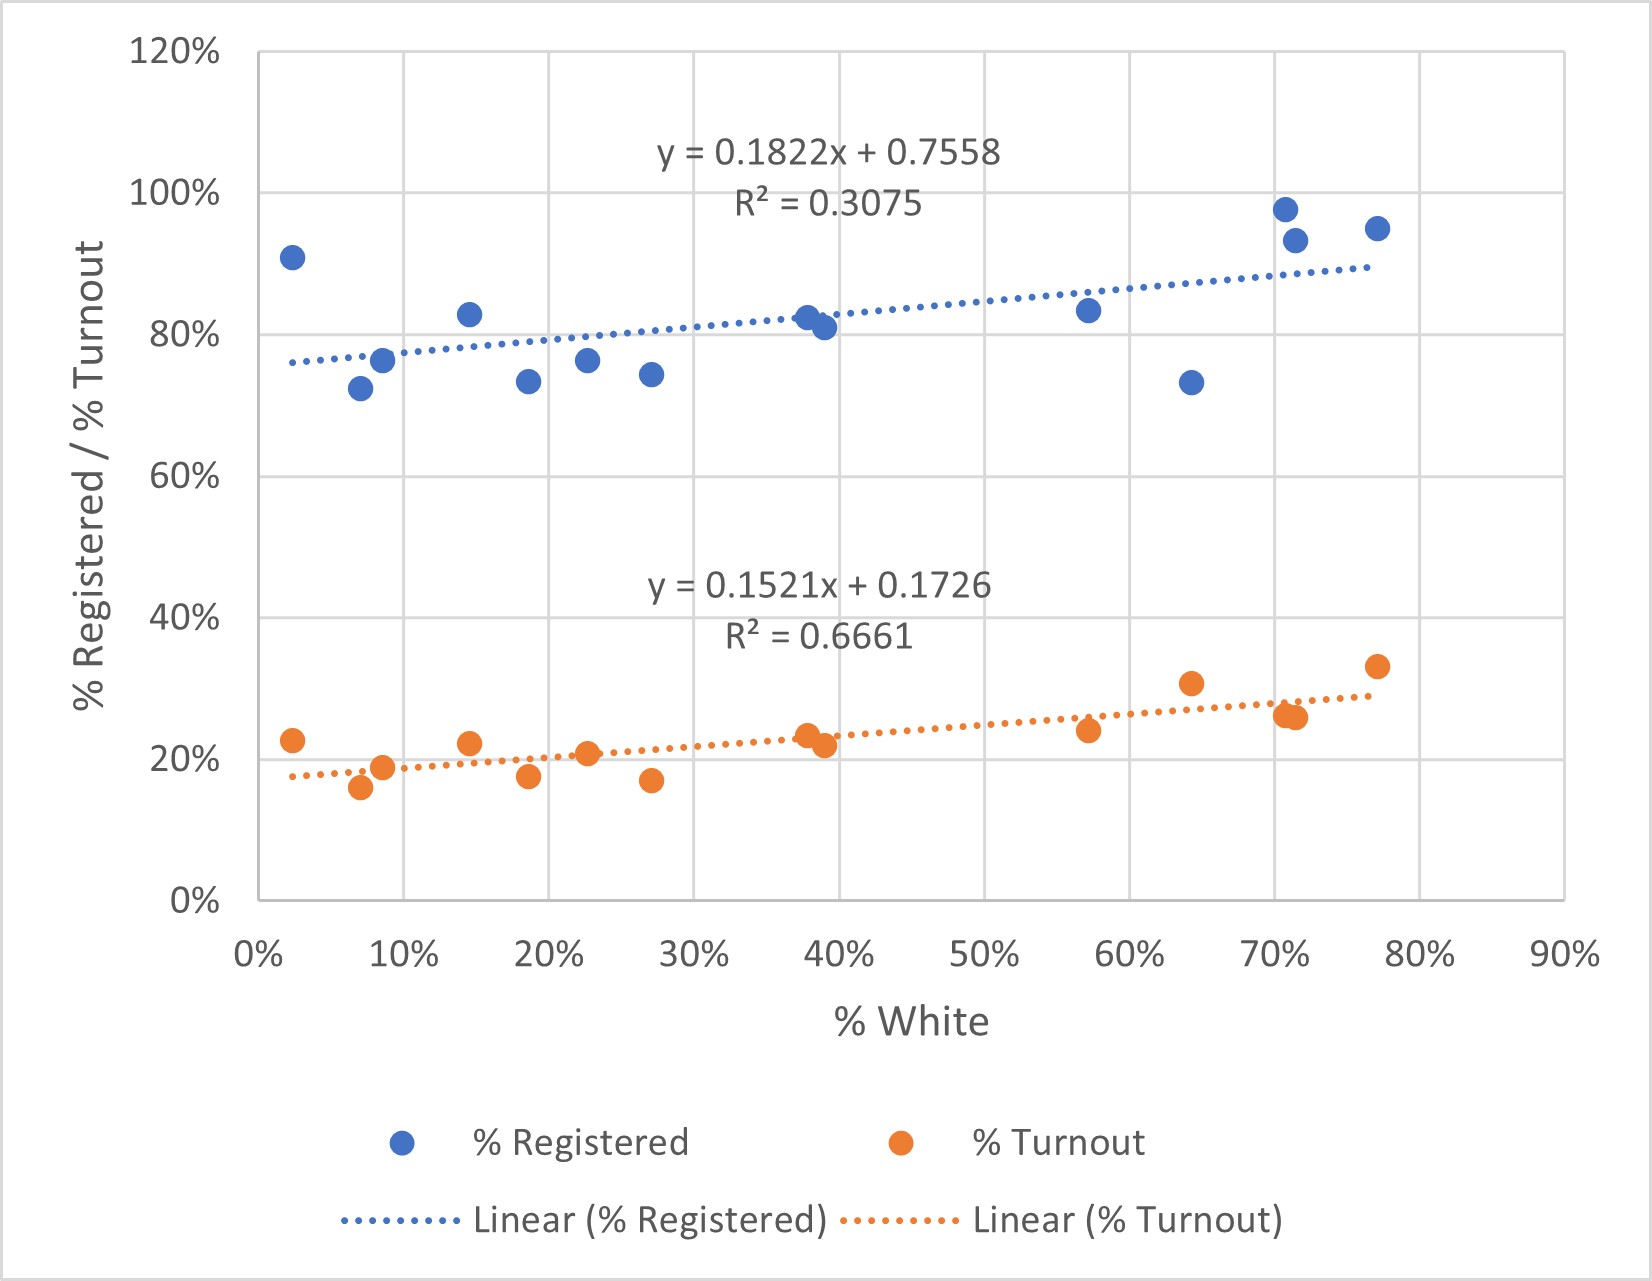
In short, the Black population of Shelby County is under-represented at the ballot box. However, this seems to be less due to barriers to registration to vote, although that is a major factor, than to barriers at the ballot box. These barriers may be anything from differences in access to transportation, childcare, work hour flexibility, and basic civic education.
**
Gregory M. Blumenthal, PhD, obtained his B.A. in Chemistry from Vanderbilt University and his doctorate in Pharmacology from Duke University. He has produced a body of work of enormous depth and breadth, encompassing research in toxicology, risk analysis, secure financial web applications, and other data science projects for such agencies as NIH, EPA, the VA, and NASA (from whom he received an award in 2014). His presentation developing objective criteria for PBPK models was expanded into the 2006 US EPA criteria for application of PBPK models to risk assessment. His specific contributions to the realm of statistical analysis continue to influence scientific analysis to this day. The August 2018 US FDA Guidance for acceptance of PBPK models in support of drug evaluations was based upon this US EPA document. Dr. Blumenthal’s strongest area of expertise is data science and data analysis, providing quantitative evaluation and GIS consulting services to Memphis-area nonprofits and government agencies. He is also strongly committed to the Memphis community, having served as co-author of the Memphis Poverty Fact Sheet since 2019, as a member of the Temple Israel delegation to Memphis Interfaith Coalition for Action and Hope (MICAH), as a technical lead for the MICAH Economic Equity Workgroup, as a volunteer consultant to UPTheEVote901, and as Campaign CIO for Steve Mulroy for District Attorney
