
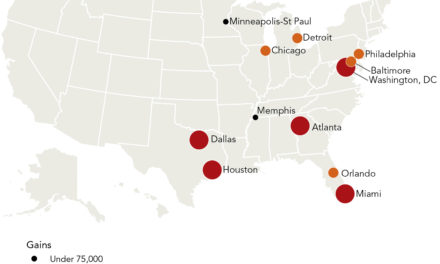
The headline: “Sun Belt Cities boom as major cities bleed population.”
Memphis has always defied Sun Belt trend lines with essentially flat population since 1970.
In truth, since that time, except for annexation, Memphis was a shrinking city as 170,000 people moved beyond the 1970 city limits.
Without annexation, Memphis’ population would be about 450,000 but instead by the 2020 Census, the population was 633,104. It had declined by 17,000 people since 2000.
Population estimates from the Census Bureau released a few days ago showed more of the same. It now estimates Memphis’ population even lower – by about 5,000 people – at 628,127.
That said, Memphis is not alone. More than half of cities with a population of more than 50,000 lost population – 424 of the 795 cities.
At the same time, the cities that gained population were especially in the Sun Belt but Memphis continues not to be among them.
Census estimates show that population growth is taking place in smaller suburbs bordering major cities. Suburban cities in the Memphis MSA are a mixed bag, but our region’s population is largely flat.
The Hill reported: “While Seattle’s population dropped by 4,200 residents last year, two of the five most popular real estate markets in the country are in Seattle’s northern suburbs of Edmonds and Woodinville. The populations of Washington, D.C., and Alexandria, Va., both dropped, but Burke, Va., just outside the Capitol Beltway, ranked as the second-hottest market in the country. Suburbs of Tampa, Fla., Denver, Los Angeles, Atlanta and St. Louis were also among the most popular markets; among their metro areas, only Tampa grew last year.”
In 1970, Memphis had climbed to become the 17th largest city but because population has stayed largely flat, today, it is #29. For context, in 1970, Nashville was #30 and today, it is #21.
That said, the Census Bureau estimated that Nashville lost 10,300 people in the last two years.
Of the cities often compared to Memphis, Jacksonville, Raleigh, and Oklahoma City gained population. Birmingham, Atlanta, St. Louis, Cincinnati, New Orleans, Louisville, and Baltimore lost population.
In Tennessee, Knoxville gained about 2,000 people, Chattanooga about 500, and Clarksville about 4,000. Jackson lost 100 people.
| Annual Estimates of the Resident Population for Incorporated Places of 50,000 or More, Ranked by July 1, 2021 Population: April 1, 2020 to July 1, 2021 | ||||
| Rank | Geographic Area | April 1, 2020 Estimates Base |
Population Estimate (as of July 1) | |
| 2020 | 2021 | |||
| 1 | New York city, New York | 8,804,190 | 8,772,978 | 8,467,513 |
| 2 | Los Angeles city, California | 3,893,986 | 3,889,834 | 3,849,297 |
| 3 | Chicago city, Illinois | 2,747,231 | 2,741,730 | 2,696,555 |
| 4 | Houston city, Texas | 2,302,792 | 2,300,027 | 2,288,250
2,288,250 |
| 5 | Phoenix city, Arizona | 1,607,739 | 1,611,345 | 1,624,569 |
| 6 | Philadelphia city, Pennsylvania | 1,603,797 | 1,601,005 | 1,576,251 |
| 7 | San Antonio city, Texas | 1,434,270 | 1,438,227 | 1,451,853 |
| 8 | San Diego city, California | 1,385,922 | 1,385,394 | 1,381,611 |
| 9 | Dallas city, Texas | 1,304,442 | 1,303,234 | 1,288,457 |
| 10 | San Jose city, California | 1,014,545 | 1,010,908 | 983,489 |
| 11 | Austin city, Texas | 959,549 | 963,121 | 964,177 |
| 12 | Jacksonville city, Florida | 949,577 | 950,463 | 954,614 |
| 13 | Fort Worth city, Texas | 918,377 | 922,592 | 935,508 |
| 14 | Columbus city, Ohio | 905,672 | 905,860 | 906,528 |
| 15 | Indianapolis city (balance), Indiana | 887,752 | 887,382 | 882,039 |
| 16 | Charlotte city, North Carolina | 874,541 | 876,747 | 879,709 |
| 17 | San Francisco city, California | 873,965 | 870,014 | 815,201 |
| 18 | Seattle city, Washington | 735,157 | 738,172 | 733,919 |
| 19 | Denver city, Colorado | 715,522 | 717,630 | 711,463 |
| 20 | Oklahoma City city, Oklahoma | 681,387 | 682,760 | 687,725 |
| 21 | Nashville-Davidson metropolitan government (balance), Tennessee | 689,504 | 689,248 | 678,851 |
| 22 | El Paso city, Texas | 678,587 | 678,598 | 678,415 |
| 23 | Washington city, District of Columbia | 689,545 | 690,093 | 670,050 |
| 24 | Boston city, Massachusetts | 676,216 | 674,272 | 654,776 |
| 25 | Las Vegas city, Nevada | 641,825 | 643,292 | 646,790 |
| 26 | Portland city, Oregon | 652,089 | 652,388 | 641,162 |
| 27 | Detroit city, Michigan | 639,614 | 638,176 | 632,464 |
| 28 | Louisville/Jefferson County metro government (balance), Kentucky | 632,689 | 632,037 | 628,594 |
| 29 | Memphis city, Tennessee | 632,207 | 631,326 | 628,127 |
| 30 | Baltimore city, Maryland | 585,708 | 583,132 | 576,498 |
| 31 | Milwaukee city, Wisconsin | 577,235 | 576,301 | 569,330 |
| 32 | Albuquerque city, New Mexico | 564,563 | 564,648 | 562,599 |
| 33 | Fresno city, California | 542,161 | 542,159 | 544,510 |
| 34 | Tucson city, Arizona | 541,349 | 541,859 | 543,242 |
| 35 | Sacramento city, California | 522,754 | 523,416 | 525,041 |
| 36 | Mesa city, Arizona | 504,500 | 505,860 | 509,475 |
| 37 | Kansas City city, Missouri | 507,969 | 507,932 | 508,394 |
| 38 | Atlanta city, Georgia | 498,602 | 499,586 | 496,461 |
| 39 | Omaha city, Nebraska | 490,627 | 491,168 | 487,300 |
| 40 | Colorado Springs city, Colorado | 479,260 | 480,213 | 483,956 |
| 41 | Raleigh city, North Carolina | 467,592 | 467,425 | 469,124 |
| 42 | Virginia Beach city, Virginia | 459,470 | 459,373 | 457,672 |
| 43 | Long Beach city, California | 466,302 | 464,759 | 456,062 |
| 44 | Miami city, Florida | 442,265 | 441,889 | 439,890 |
| 45 | Oakland city, California | 439,349 | 439,341 | 433,823 |
| 46 | Minneapolis city, Minnesota | 428,403 | 429,014 | 425,336 |
| 47 | Tulsa city, Oklahoma | 412,458 | 412,629 | 411,401 |
| 48 | Bakersfield city, California | 402,907 | 403,401 | 407,615 |
| 49 | Wichita city, Kansas | 397,070 | 397,117 | 395,699 |
| 50 | Arlington city, Texas | 394,218 | 393,985 | 392,786 |
| 51 | Aurora city, Colorado | 386,241 | 386,580 | 389,347 |
| 52 | Tampa city, Florida | 382,769 | 383,980 | 387,050 |
| 53 | New Orleans city, Louisiana | 383,997 | 383,282 | 376,971 |
| 54 | Cleveland city, Ohio | 373,091 | 372,032 | 367,991 |
| 55 | Anaheim city, California | 347,015 | 347,089 | 345,940 |
| 56 | Urban Honolulu CDP, Hawaii | 350,943 | 349,800 | 345,510 |
| 57 | Henderson city, Nevada | 317,521 | 319,055 | 322,178 |
| 58 | Stockton city, California | 320,759 | 320,745 | 322,120 |
| 59 | Lexington-Fayette urban county, Kentucky | 322,570 | 322,403 | 321,793 |
| 60 | Corpus Christi city, Texas | 317,929 | 317,852 | 317,773 |
| 61 | Riverside city, California | 314,347 | 314,655 | 317,261 |
| 62 | Santa Ana city, California | 310,538 | 309,888 | 309,441 |
| 63 | Orlando city, Florida | 307,674 | 307,603 | 309,154 |
| 64 | Irvine city, California | 305,313 | 306,389 | 309,031 |
| 65 | Cincinnati city, Ohio | 310,242 | 310,113 | 308,935 |
| 66 | Newark city, New Jersey | 310,876 | 310,350 | 307,220 |
| 67 | St. Paul city, Minnesota | 311,448 | 310,942 | 307,193 |
| 68 | Pittsburgh city, Pennsylvania | 303,160 | 302,777 | 300,431 |
| 69 | Greensboro city, North Carolina | 297,899 | 297,808 | 298,263 |
| 70 | St. Louis city, Missouri | 301,578 | 300,528 | 293,310 |
| 71 | Lincoln city, Nebraska | 291,114 | 291,383 | 292,657 |
| 72 | Plano city, Texas | 285,900 | 286,668 | 288,253 |
| 73 | Anchorage municipality, Alaska | 291,247 | 290,637 | 288,121 |
| 74 | Durham city, North Carolina | 283,547 | 284,400 | 285,527 |
| 75 | Jersey City city, New Jersey | 292,412 | 291,927 | 283,927 |
| 76 | Chandler city, Arizona | 276,330 | 277,556 | 279,458 |
| 77 | Chula Vista city, California | 276,025 | 276,466 | 277,220 |
| 78 | Buffalo city, New York | 278,302 | 277,908 | 276,807 |
| 79 | North Las Vegas city, Nevada | 262,678 | 264,216 | 274,133 |
| 80 | Gilbert town, Arizona | 268,302 | 269,206 | 273,136 |
| 81 | Madison city, Wisconsin | 268,414 | 268,846 | 269,196 |
| 82 | Reno city, Nevada | 263,436 | 264,116 | 268,851 |
| 83 | Toledo city, Ohio | 270,726 | 270,041 | 268,508 |
| 84 | Fort Wayne city, Indiana | 263,852 | 264,169 | 265,974 |
| 85 | Lubbock city, Texas | 257,180 | 257,882 | 260,993 |
| 86 | St. Petersburg city, Florida | 258,277 | 258,658 | 258,201 |
| 87 | Laredo city, Texas | 255,181 | 255,336 | 256,153 |
| 88 | Irving city, Texas | 256,793 | 256,873 | 254,198 |
| 89 | Chesapeake city, Virginia | 249,422 | 249,679 | 251,269 |
| 90 | Winston-Salem city, North Carolina | 249,443 | 249,349 | 250,320 |
| 91 | Glendale city, Arizona | 248,345 | 248,797 | 249,630 |
| 92 | Scottsdale city, Arizona | 241,488 | 241,933 | 242,753 |
| 93 | Garland city, Texas | 246,132 | 245,478 | 242,035 |
| 94 | Boise City city, Idaho | 235,670 | 235,829 | 237,446 |
| 95 | Norfolk city, Virginia | 238,005 | 237,591 | 235,089 |
| 96 | Spokane city, Washington | 228,831 | 228,850 | 229,071 |
| 97 | Fremont city, California | 232,084 | 231,673 | 227,514 |
| 98 | Richmond city, Virginia | 226,610 | 226,670 | 226,604 |
| 99 | Santa Clarita city, California | 229,213 | 228,487 | 224,593 |
| 100 | San Bernardino city, California | 221,898 | 221,784 | 222,203 |


