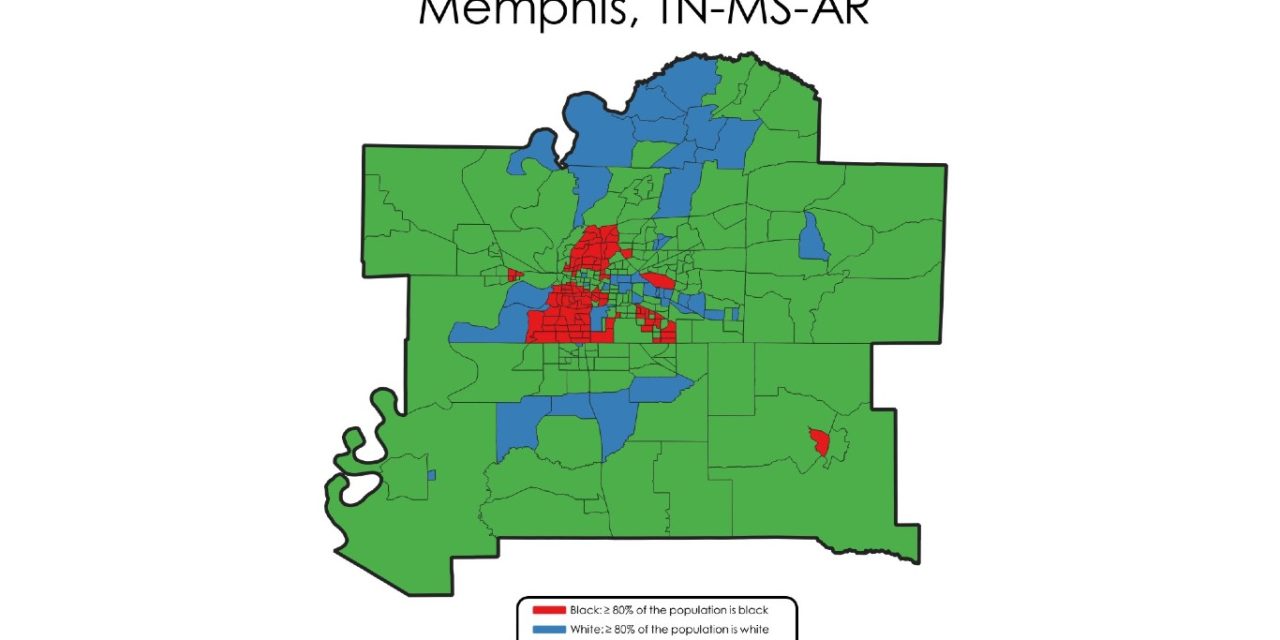
Memphis regularly is included on lists of the most segregated U.S. cities.
Looking backward, it’s easy to identify factors that contributed to it: white flight, middle income flight, annexation, stagnant population, and lack of investments in core neighborhoods that led to census tracts where concentrated poverty has roughly doubled since 1970.
Our favorite researcher, Joe Cortright at City Observatory, bases his ranking on the Racial Dissimilarity Index, which measures the percentage of the non-Hispanic white population in a county which would have to change Census tracts to equalize the racial distribution between white and non-white population groups all tracts in the county.
The median large metro areas in the U.S. have a dissimilarity index of 45, meaning that about 45 percent of a city’s population would have to move to balance the composition of individual neighborhoods to the region’s overall demographic composition. About half of all large cities have dissimilarity indices between 38 and 54.
In Memphis, it is 61.05. That ranks it at #6 on the list of most segregated cities.
1 of 6 Cities
The five cities ranked ahead of Memphis are: Milwaukee – 61.39; Buffalo – 61.63; Philadelphia – 61.93; New Orleans – 62.01; and Detroit – 68.52. These cities and Memphis are the only ones with a racial dissimilarity index of more than 60.
Nashville’s index is 42.84, Louisville’s is 44.01, and Baltimore’s is 50.36.
The least segregated city in the U.S. is Portland at 27.33. It is followed by Virginia Beach, 32.99; Boston, 33.80; Seattle, 34.19; Las Vegas, 35.27; and Richmond, 35.95.
Mr. Cortright wrote: “The murder of George Floyd by police has reignited national interest in making more progress toward racial justice. It’s prompted a new round of introspection about racism that’s deeply embedded in many American policies and institutions. One pervasive and lingering hallmark is racial residential segregation; our cities have literally been divided by race,, and as numerous studies have shown, this has undercut opportunity, perpetuated poverty, limited economic mobility, and eroded Black wealth.
Region Ranked #5
According to 247 Wall St., whose list got wide national media coverage, the 10 most segregated metros are:
- Columbus, GA
9. Montgomery, AL
8. Cleveland, OH
7. Detroit, MI
6. Monroe, LA
5. Memphis
4. Albany, GA
3. Jackson, MS
2. Milwaukee, WI
1. Pine Bluff, AR.
247 Wall St. wrote:
- Memphis, TN-MS-AR
> Black pop. in Black neighborhoods:72.2% (453,524)
> Black population:46.9% (627,814)
> Black poverty rate: 25.5% (156,810)
> White poverty rate: 9.4% (57,126)
An estimated 72.2% of the Black population in the Memphis metropolitan area live in neighborhoods where more than half of the residents are also Black, far more than the 19.5% national share. Segregated Black neighborhoods in racially divided cities often lack access to education and employment opportunities and are more likely to struggle with poverty than white neighborhoods.
In Memphis, just 17.7% of adults in majority-Black neighborhoods have a bachelor’s degree, compared to 36.6% of adults in majority-white neighborhoods — one of the larger gaps in college attainment of any metropolitan area. The income gap between Black and white households in Memphis is just over $33,000, and 26.7% of residents of Black neighborhoods live in poverty — nearly three times the 9.5% poverty rate in primarily white neighborhoods.
Memphis’ Best Ranking
Meanwhile, University of California – Berkeley’s Othering and Belonging Institute, using its own methodology has Memphis ranked #20 for cities with more than 200,000 people. It’s the best ranking for Memphis I’ve seen:
| Rank | City | Divergence | Segregation Category |
| 1 | Detroit city, MI | 0.8412 | High Segregation |
| 2 | Hialeah city, FL | 0.7229 | High Segregation |
| 3 | Newark city, NJ | 0.6791 | High Segregation |
| 4 | Chicago city, IL | 0.6572 | High Segregation |
| 5 | Milwaukee city, WI | 0.6176 | High Segregation |
| 6 | Cleveland city, OH | 0.5869 | High Segregation |
| 7 | Miami city, FL | 0.4987 | High Segregation |
| 8 | Birmingham city, AL | 0.4953 | High Segregation |
| 9 | New York city, NY | 0.4881 | High Segregation |
| 10 | St. Louis city, MO | 0.4728 | High Segregation |
| 11 | Atlanta city, GA | 0.445 | High Segregation |
| 12 | Philadelphia city, PA | 0.4421 | High Segregation |
| 13 | Irving city, TX | 0.4355 | High Segregation |
| 14 | Oakland city, CA | 0.4289 | High Segregation |
| 15 | Dallas city, TX | 0.4247 | High Segregation |
| 16 | Irvine city, CA | 0.4153 | High Segregation |
| 17 | Buffalo city, NY | 0.4047 | High Segregation |
| 18 | Boston city, MA | 0.3962 | High Segregation |
| 19 | Santa Ana city, CA | 0.395 | High Segregation |
| 20 | Memphis city, TN | 0.3717 | High Segregation |
“Socioeconomic mixing, in neighborhoods that are diverse in race, ethnicity, and income, benefits everyone,” wrote Mr. Cortright. “To some extent, we take for granted that integration and equal opportunity should be valued for their own sake. But it’s worth noting that achieving greater integration along both racial/ethnic and income dimensions is important to achieving more widespread prosperity and combatting poverty…
“Neighborhoods of concentrated disadvantage are not simply places where many households suffer from their own individual problems. The segregation of poverty creates itw own additional, collective burden on residents of these communities.
“More integrated neighborhoods and more integrated cities enjoy better economic results and produced better lifetime opportunities for their children. These findings point up the critical importance of the role of the nation’s racially and ethnically diverse, mixed income neighborhoods.”
***
Join us at the Smart City Memphis Facebook page for daily articles, reports, and commentaries relevant to Memphis and the conversations that begin here.


