From School Finance 101 blog:
Despite all of AQE’s complaints, there is no need to change the way we allocate this money, since the state already directs almost 70 percent of education funding to high-need districts. In fact, School Funding Fairness’s National Report Card gave New York a grade of “A” in its Effort category, putting us among the top five states in that category.
Apparently the authors of this quote have a little difficulty reading and perhaps some problems interpreting relatively simple numbers and letter grades.
Let’s take a look at the graded indicators in our school funding fairness report:
- Effort – This measures differences in state spending for education relative to state fiscal capacity. “Effort” is defined as the ratio of state spending to state per capita gross domestic product (GDP).
- Funding Distribution – This measures the distribution of funding across local districts within a state, relative to student poverty. The measure shows whether a state provides more or less funding to schools based on their poverty concentration, using simulations ranging from 0% to 30% child poverty.
http://www.schoolfundingfairness.org/National_Report_Card_2012.pdf
The authors use the state’s high grade on “effort” as basis for asserting that New York State has no allocation problem. Hmmm… perhaps the distribution indicator would be a better indicator for whether the state has an allocation problem. After all, even a quick synonym check in MS Word lists distribution as the first synonym for allocation (followed by provision, apportionment, sharing).
New York Received a D on this measure!
And a D is actually rather generous for New York’s distribution/allocation issues. Figure 1 provides the profile for mid-Atlantic states from our funding fairness report.
Figure 1
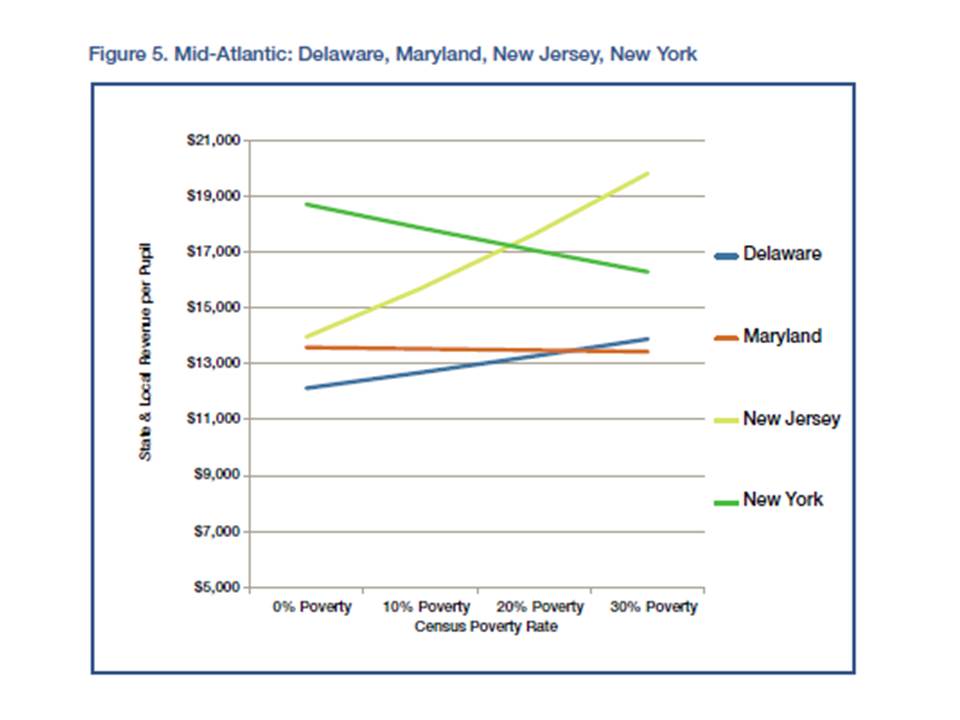 In other words, in New York State, higher poverty districts have systematically less per pupil state and local revenue than do lower poverty ones. And despite all of the other completely ridiculous a-contextual and otherwise wrong and misleading claims in the Op-ed, high need New York State school districts face significant financial disadvantages relative to their competitive surroundings.
Despite the Op-Ed authors claims, their Governor has done little or nothing to help these districts, and much to harm them (including misguided reforms).
Sean Corcoran of NYU and I dug deeper into New York State’s distribution issues and sources of inequity in a recent report for the Center for American Progress.
First, with updated analysis following the funding fairness methods, we identify New York State as among the least equitable states in the Nation. Here are the numbers:

And here’s a nice colored map (which may resonate with the editorial authors who’s grasp of numbers appears severely limited):

http://www.americanprogress.org/wp-content/uploads/2012/09/StealthInequities.pdf
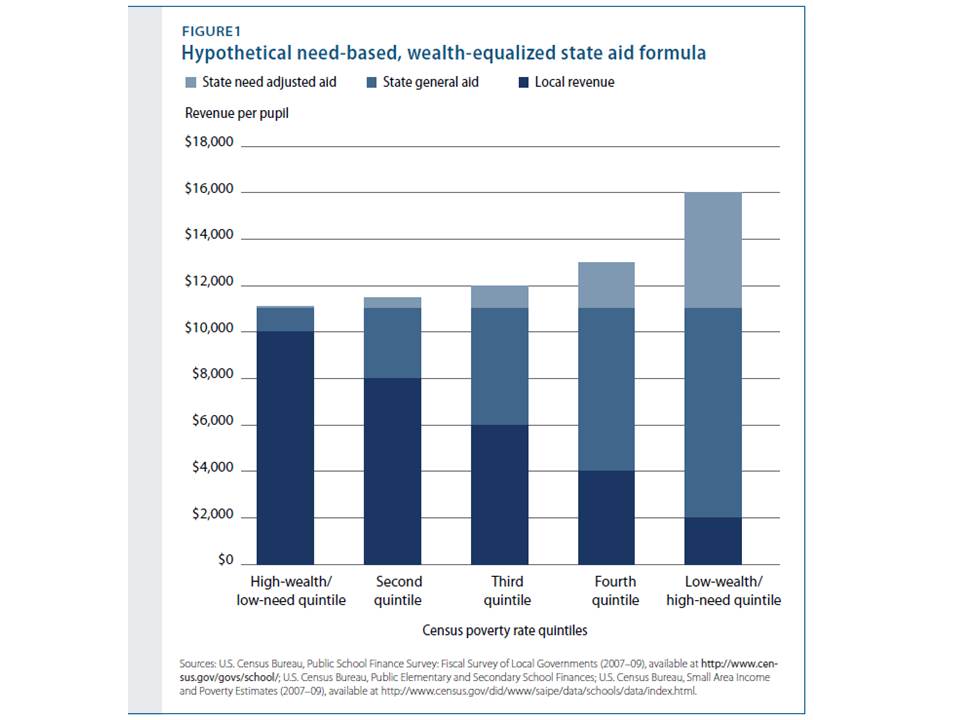
We explain that a hypothetical, rational, equitable school funding system should look something like this:
 But that New York’s system actually looks like this – when not correcting for costs/needs (it’s much, much worse when you do!).
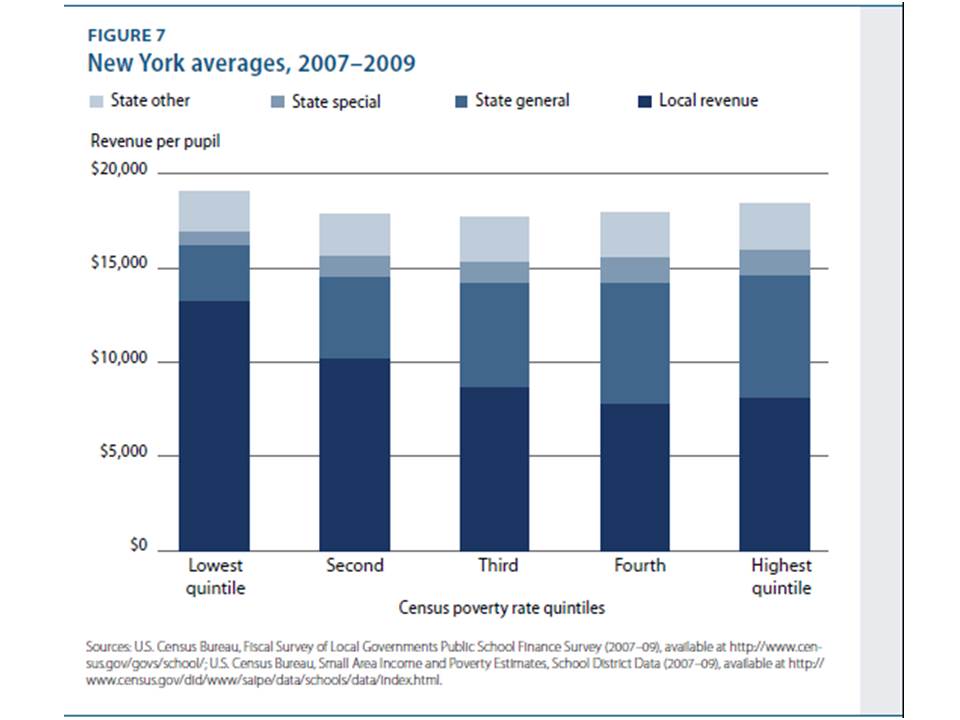
We also then identify and explain the various sources of inequity in New York State’s school finance system, including the allocation of Tax Relief aid disproportionately to wealthier districts, and other adjustments to foundation aid that favor wealthier districts to the detriment of poorer ones. Here are some figures, and descriptions from our report:
Figure 13 puts New York’s School Tax Relief program aid allocations into context. Federal aid to schools is largely designed to improve equity by targeting resources to higher-need, especially higher-poverty, districts. The School Tax Relief program aid to New York schools tends on average to be slightly less than federal aid. But to the extent that federal aid creates any improvement to the distribution of resources across New York school districts, the state’s School Tax Relief program aid wipes out that improvement entirely. Aid under the program, which is indicated by the darkest blue in Figure 13, is allocated in nearly perfectly inverse proportion to federal aid, such that when the two are stacked on the other, the cumulative effect is that districts receive about the same regardless of their wealth.

New York’s foundation-aid formula includes a series of “if/then” steps to determine whether a district should receive state aid based on its initial calculation of local fair share or based on an alternative calculation, one of which is the provision of minimum aid of $500 per pupil. Figure 17 shows the pattern of state and local sharing that would occur if foundation aid were based solely on the income-wealth index estimated by the state. Under that index, the lowest-wealth districts would receive about $12,000 to $14,000 in aid per pupil, and districts with an income-wealth index greater than 1 would receive no aid. After including the various alternative calculations, districts with an income-wealth index above about 2.5 would receive the minimum of $500 per pupil, while districts with index rates from 1 to 2.5 would receive a sliding scale toward the minimum rather than either the minimum or $0. The adjusted version is shown in red. Note however, that neither was fully funded in recent years. (Recent reality is achieved by taking the red squares and shifting them downward but preserving the minimum aid.)

If fully funded, the cost of retaining the minimum aid provision tops $1.2 billion, and the cost of preserving the diagonal, sliding-scale adjustment between the income-wealth index of 1 and 2.5 is $2.47 billion (if we exclude the disproportionate effects of New York City). That’s real money—money that could be perhaps targeted toward higher-need districts to reduce the overall regressive nature of New York’s finance system.

The cumulative effects of these adjustments and the School Tax Relief program on the distribution of resources across New York school districts is shown above. The left hand portion of Figure 18 shows local revenue with formula aid prior to the adjustments in Figure 17. Even this isn’t a very pretty picture because state aid remains insufficient to provide even nominal funding equity from lower- to higher-poverty districts. But the right hand side of Figure 18 shows the effect of the adjustments in Figure 17, with the icing of school tax relief aid on top.
Prior to foundation-sharing adjustments and the School Tax Relief program aid, the per-pupil difference in state and local revenue per pupil between the lowest- and highest-poverty quintile is about $1,100. After the adjustments, the per-pupil difference is more than $2,300. New York makes adjustments to its aid formula and throws on tax relief funding in a pattern that more than doubles the nominal inequity between the state’s lowest- and highest-poverty districts.
In other words – YES – NEW YORK DOES NEED TO CHANGE THE WAY IT ALLOCATES MONEY. Any suggestion to the contrary displays a mind-boggling degree of ignorance!