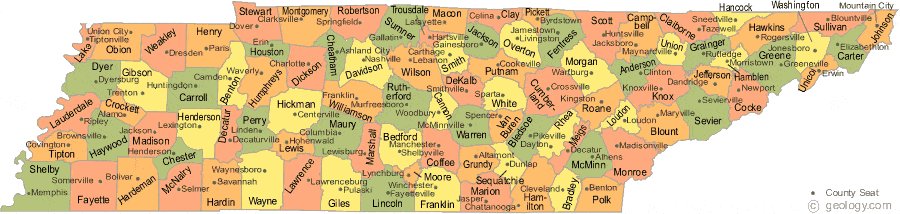
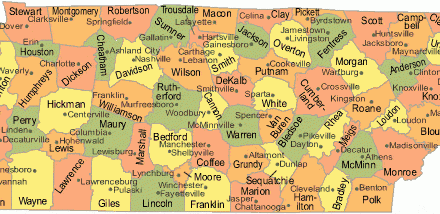
About three weeks ago, I posted some key metrics that showed Shelby County’s ranking in comparison to Tennessee’s other 94 counties. Because of the interest shown in the comparisons, which indicated structural challenges and opportunities, I am posting more.
Here they are:
#68 – Women living in poverty
#68 – Seniors living in poverty
#51 – African American Households receiving food stamps
#78 – Cost of living
#25 – Median household income
#5 – Average wages and salaries
#91 – Income inequality
#85 – Debt in collections
#3 – Debt to income ratio
#93 – Auto and retail loan delinquency rate
#85 – Median credit score
#61 – Households with children receiving food stamps
#16 – Youth obesity
#71 – Disconnected youth
#92 – Children in single-parent households
#72 – Children receiving public assistance
#43 – Adult obesity
#5 – Adults who smoke
#34 – Fatal drug overdoses
#61 – Teen births
#86 – Age of housing stock
#58 – Incarceration rate
#95 – Crime rate
#84 – Firearm fatalities
#26 – Voter registration
#83 – Registered voter turnout
#1 – In-person early voting turnout
#1 – Nonprofit giving
#8 – Public school teacher salary
#75 – High school graduation rate
#1 – Residents commuting to work outside the county of residence
#84 – Road quality
#8 – Broadband access
#20 – Renewable energy production
#91 – Air pollution
#24 – Average annual energy cost
#8 – Household energy burden
#91 – Renter cost burdened
#76 – Child cost burden
#94 – Injury crash rate
All data compiled by Think Tennessee in its State of Our Counties report.
**
**
These commentaries are also posted on the Smart City Memphis Facebook page and on Instagram along with occasional articles, reports, and commentaries that are relevant to Memphis.
