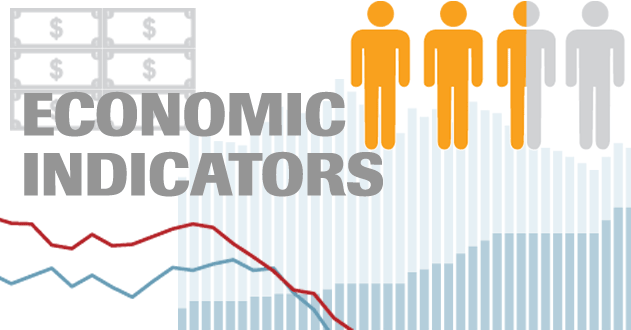
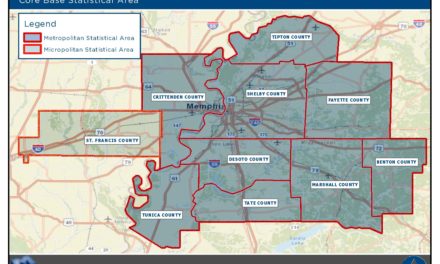
The following are data for the Memphis MSA TN-MS-AR. It requires no commentary to see the lost economic power that results from income disparities and the disproportionate reliance on low-wage jobs:
Median Household Income – African American:
$46,600 – DeSoto County
$32,926 – Shelby County
$31,437 – Marshall Country
$31,071 – Fayette County
$30,694 – Tipton County
$28,416 – Tunica County
$25,553 – Crittenden County
Median Household Income – Whites:
$66,517 – Shelby County
$63,996 – Fayette County
$61,612 – DeSoto County
$58,999 – Tipton County
$56,377 – Crittenden County
$53,820 – Tate County
$44,634 – Tunica County
$42,446 – Marshall County
Poverty by Race & Ethnicity
158,109 – African American of 622,619
63,892 – White of 597,613
23,503 – Hispanic of 71,118
12,752 – Other
2,274 – Asian
Highest Paid Jobs by Median Earnings:
$79,777 – Legal
$77,618 – Architecture and Engineering
$74,416 – Health Practitioners
$68,313 – Computer and Mathematical
$65,737 – Management
Lowest Paid Jobs by Median Earnings:
$11,510 – Food and Serving
$17,754 – Cleaning and Maintenance
$17,878 – Personal Care and Service
$20,826 – Material Moving *
$25,355 – Health Care Support
Note: Compared to other metro areas, Memphis TN-MS-AR has an unusually high number of residents working in Material Moving; Transportation; and Health Technicians.
Most Common Jobs:
87,165 – Administrative
67,945 – Sales
53,902 – Management
37,848 – Production
36,247 – Education, Training and Library
Least Common Jobs:
1,267 – Farming, Fishing and Forestry
4,477 – Life, Physical and Social Science
5,586 – Firefighting Supervisors
6,018 – Legal
6,785 – Arts and Recreation
Most Common Industries:
82,124 – Health Care and Social Assistance
72,763 – Retail Trade
68,434 – Transportation and Warehousing
58,587 – Manufacturing
51,718 – Educational Services
Source: ACS 5-year Estimate, 2015, U.S. Census Bureau
***
Join us at the Smart City Memphis Facebook page for daily articles, reports, and commentaries relevant to Memphis.

Your data points don’t back your assertion that there’s “lost economic power that results from income disparities and the disproportionate reliance on low-wage jobs”. You’ve thrown a bunch of numbers up there, but you’ve provided no analysis to support your hypothesis. Why is median household in Crittenden County lower (for both races) than Shelby County?
George:
We give the readers of this blog credit for seeing the obvious conclusions from these data points. That said, we’ve provided 13 years of analysis on the question of the economic drag caused by income disparities (after all, if African Americans earned the same as whites, the GDP would increase more than $21B, as we have often written) and the overdependence on low-wage jobs goes hand-in-hand with the lost economic power.
Here are but two related posts from the past four months:
http://www.smartcitymemphis.com/2017/04/the-regions-1-economic-development-priority-closing-income-disparities/
http://www.smartcitymemphis.com/2017/10/the-injustice-of-a-memphis-economy-built-on-low-wage-jobs-2/
Here are a couple of others:
http://www.smartcitymemphis.com/2017/01/the-21-billion-economic-opportunity-closing-the-income-gap/
http://www.smartcitymemphis.com/2016/09/economic-prosperity-hinges-on-reducing-poverty/
As for Crittenden County, it has a 26% poverty rate, and its economy has long been rooted in low-wage jobs. It dates back to Northeast Arkansas’ agricultural days and now to its distribution/logistics/warehouses reliance.
You said that Memphis had low wages because of distribution/logistics/warehouses reliance, but now you’re saying that Crittenden County is lower than Memphis because of those same jobs. You’re not making sense.
The analysis is going to have to be deeper than just “this guy’s paycheck is bigger than that guy’s.” If you’re 6’5″ and I’m 5’5″, is the difference genetics, nutrition, random variation, environmental factors, some combination of each?
It’s not as simple as ” if African Americans earned the same as whites.” Some african Americans do earn as much as whites. Some earn more. Is the difference only attributable to race, or are there other factors? If you’re only looking at race, you’re never going to find an answer and you’re only going to perpetuate the conditions you claim to want to solve. If you keep doing it over and over, it looks like you don’t really want to solve that problem at all.
Check Bureau of Labor statistics for Crittenden County. The economic sectors there make Shelby County look sterling. Northeast Arkansas has had a long history of concentrated poverty and an economy anchored in the jobs that exploit these workers. Crittenden County does not have the kind of economic mix that Shelby County does and it shows up in the median family incomes.
Not sure what you’re trying to say in the second paragraph.
We’ve written numerous times about the reasons for the difference between African American and white salaries – institutional racism, the vested interest by large employers in having a ready pool of low-cost workers, building an economic development agenda built on cheapness, lack of investment in workforce, the mistaken assumption 37 years ago that tourism, logistics, etc., were the jobs of the future, etc.
It is definitely about race. Acknowledging that is a major step in addressing the conditions that need to be improved here.
http://www.smartcitymemphis.com/2017/10/the-injustice-of-a-memphis-economy-built-on-low-wage-jobs-2/