This post is written by Jimmie Covington, veteran Memphis reporter with lengthy experience covering governmental, school, and demographic issues. He is a contributing writer with The Best Times, a monthly news magazine for active people 50 and older, where this appears in the April issue.
By Jimmie Covington
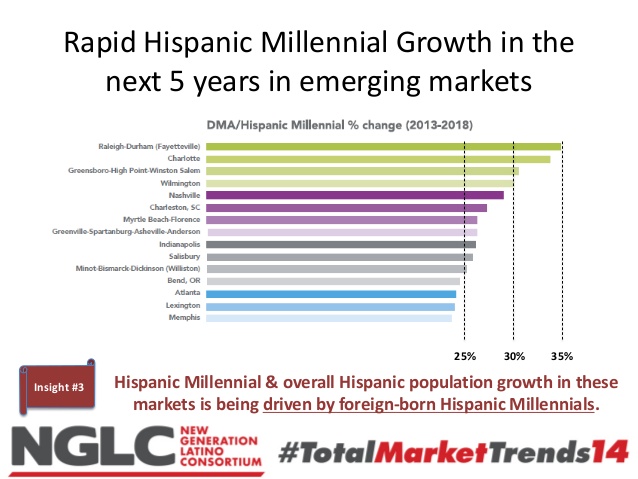
Nashville’s faster growing Hispanic population is a significant factor in that city’s moving ahead of Memphis to become Tennessee’s largest city, U.S. Census Bureau numbers show.
Census count numbers show that Memphis’ Hispanic population increased from 20,189 in 2000 to 41,994 in 2010 while the Nashville Hispanic population increased from 25,774 to 60,390.
In 2010, 6.49 percent of Memphis’ residents were Hispanic and 10.04 percent of Nashville’s residents were Hispanic.
Estimates of cities’ Hispanic residents on July 1, 2016, are not currently available. However, countywide estimates, which were released earlier in the year, show Davidson County with a net gain of 3,091 from international migration in the year ending July 1, 2016, and a Shelby County net gain of 1,258.
In both cities, many residents gained from international migration are Hispanic.
And since Nashville and Davidson County have a consolidated government, Davidson County census numbers are more reflective of Nashville, than Shelby County numbers are of Memphis.
In reporting city populations, the Census Bureau refers to the Nashville city population as “Nashville-Davidson metropolitan government (balance).” The population numbers of six incorporated municipalities that are either entirely or partly located in Davidson County are listed separately from the Nashville numbers.
The July 1, 2016, population estimates show 660,388 of Davidson County’s 684,410 residents, or 96.5 percent, are included in the Nashville number. In Shelby County, the estimates reflect that 652,217, or 69.8 percent, of Shelby County’s 934,603 residents lived in Memphis.
Shelby County remains the state’s largest population county.
According to the 2016 city estimates, which were released in May, Nashville had 7,761 more residents than Memphis. The estimates for July 1, 2015, in the 2016 report were Memphis, 654,454, and Nashville, 654,078.
And it might be just a one-year aberration in the numbers, but the census county estimates for July 1, 2016—which were released in March—show Davidson County with a net domestic migration loss of 2,039 in the previous year.
That means an estimated 2,039 more residents moved out of Davidson to other counties in the United States during the year than moved into Davidson from other counties.
The county estimates also show that Davidson had a net gain of 10,489 from domestic migration since 2010 and a net gain of 17,445 from international migration. Over that same period, Shelby County had a net loss of 36,795 to domestic migration and a net gain of 7,859 from international migration.
Other major factors of population change are births and deaths. The census reports show that Shelby County had a population natural increase of 36,853 from births exceeding deaths during 2010-2016 while Davidson County’s natural increase was 30,279.
A major thing that sets the Nashville metro area off from the Memphis area is the large growth that has occurred in the Nashville area’s outlying counties compared to the Memphis area counties.
Nashville and Davidson County have had good growth through the years but the majority of the area growth has occurred in other counties. The Nashville-Davidson-Murfreesboro-Franklin Metropolitan Statistical Area now consists of Davidson and 13 other counties.
The Memphis TN-MS-AR MSA includes Shelby and eight other counties. The makeup of MSAs is determined by the U.S. Office of Management and Budget based on data from each 10-year census.
An MSA consists of a central city and surrounding counties that have strong business and other connections with the central city.
The results of the 2000 Census first placed the Nashville metro area ahead of the Memphis area in population. The July 1, 2016, census estimates show the Nashville area with 1,865,298 residents and the Memphis area with 1,342,842 residents.
According to these estimates, Davidson County’s population increase during 2010-2016 was 57,830 while the increase in the area’s 13 other counties was 136,585, which made a total area increase of 194,415.
In contrast, the Memphis area total increase was 18,018, including 6,919 in Shelby County and 11,909 in the outlying counties. DeSoto County had a 14,347 increase but all but two of the other counties, Fayette and Tipton in Tennessee, had declines.
Here are the 2010 Census counts and the July 1, 2016, estimates of the populations in the counties that make up the Memphis and Nashville Metropolitan Statistical Areas.
(Calculations using these numbers may differ a little from the growth numbers in the above story. In yearly estimates reports, the Census Bureau uses an estimates base that includes minor adjustments to official census count numbers. The numbers in the story are from the estimates reports.)
Memphis MSA—
Counties 2010 Census 2016 Estimates Change
Shelby 927,644 934,603 +6,959
Fayette 38,413 39,590 +1,177
Tipton 61,081 61,303 +222
Crittenden 50,902 49,235 -1,667
Benton 8,729 8,264 -465
DeSoto 161,252 175,611 +14,359
Marshall 37,144 35,801 -1,343
Tate 28,886 28,201 -685
Tunica 10,778 10,234 -544
Nashville MSA—
Davidson 626,681 684,410 +57,729
Cannon 13,801 14,027 +226
Cheatham 39,105 39,880 +775
Dickson 49,666 52,170 +2,504
Hickman 24,690 24,295 -395
Macon 22,248 23,450 +1,202
Maury 80,956 89,981 +9,025
Robertson 66,283 69,165 +2,882
Rutherford 262,604 308,251 +45,647
Smith 19,166 19,447 +281
Sumner 160,645 180,063 +19,418
Trousdale 7,870 8,271 +401
Williamson 183,182 219,107 +35,925
Wilson 113,993 132,781 +18,788
Source: U.S. Census Bureau
***
Join us at the Smart City Memphis Facebook page for daily articles, reports, and commentaries that are relevant to Memphis.


Nashville and its entire MSA are absolutely on fire with growth and development of all types. We visited family up there last month and the new construction, renovations and cranes for high rise buildings is everywhere. They don’t seem to be able to build new hotels and apartments fast enough. We know several recent college graduates from here who have landed great jobs there. The traffic is terrible though. Nashville and Memphis are like two totally different cities even though both are in the same state.
The population numbers are not surprising. Nashville has been growing at a very fast pace for a long time. The economy there is strong and people are better educated and wealthier compared to Memphis. Hispanic populations are growing everywhere across the USA and many find work in construction jobs and Nashville has a huge amount of construction going on.