Dr. Elena Delavega, University of Memphis Department of Social Work, publishes the must-read report each year on Memphis poverty. The Memphis Poverty Fact Sheet is an important academic analysis for our community and a valuable contribution to our civic conversations.
Based on this year’s report, most measures of poverty increased from 2017 to 2018:
Among the 36 cities whose populations are greater than 500,000, Memphis has the second highest rate of poverty, up from #4 last year. Only Detroit has a higher rate – 33.4%. Memphis moved up from fourth place to second place in the percentage of children living in poverty.
Among the 120 cities whose populations are greater than 200,000, Memphis is #5, moving up from #6 last year.
The following data come from her reports:
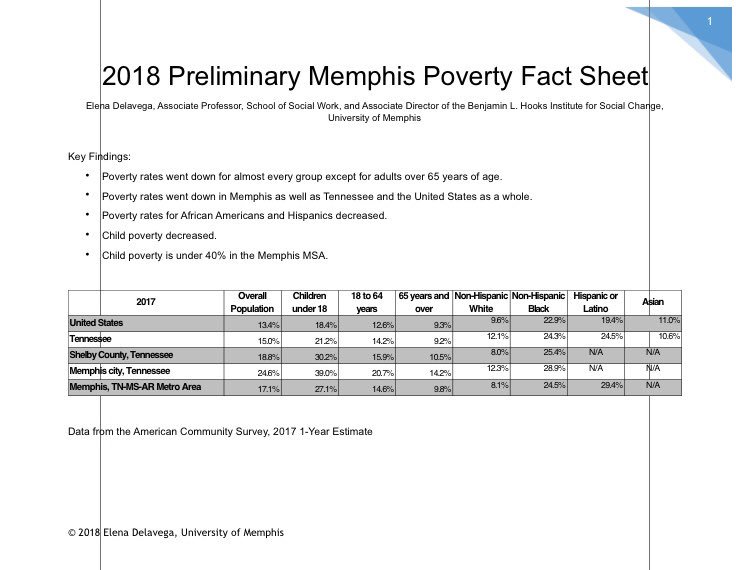
Poverty Rates
Memphis
2018: 27.8%
2017: 24.6%
2016: 26.9%
2015: 26.2%
2014: 29.8%
2013: 27.7%
2011: 27.2%
Shelby County
2018: 21.7%
2017: 18.8%
2016: 20.8%
2015: 20.1%
2014: 22.9%
2013: 21.8%
Memphis MSA
2018: 18.8%
2017: 17.1%
2016: 19.4%
2015: 26.2%
2014: NA
2013: NA
Poverty Rate for children under 18 – Memphis
2018: 44.9%
2017: 39.0%
2016: 44.7%
2015: 43.0%
2014: 46.9%
2013: 45.7%
2011: 42.1%
Poverty Rate for African Americans – Memphis
2018: 33.8%
2017: 28.9%
2016: 32.3%
2015: 30.1%
2014: 34.4%
2013: 33.5%
2011: 33.7%
Poverty Rate for Whites – Memphis
2018: 11.8%
2017: 12.3%
2016: 13.3%
2015: 13.0%
2014: 13.5%|
2013: 9.8%
2011: 12.6%
Poverty Rate for Latinos – Memphis
2018: 28.8%
2017: 33.3%
2016: NA
2015: NA
2014: 45.5%
2013: 47.0%
2011: 36.4%
***
Join us at the Smart City Memphis Facebook page for daily articles, reports, and commentaries relevant to Memphis and the conversations that begin here.


It is an interesting and sad fact that a booming economy does so little for the reduction of poverty. Ten years of prosperity and low unemployment rates (even in Memphis) and the poverty rate actually increased for 2018. A rising tide does NOT raise all boats.
Conditions of employment — low wages, on-demand hours, short work weeks, multiple jobs — all probably have something to do with the level of poverty in Memphis. But probably the majority of the poverty — particularly poverty among children — is just related to poor social policy. Society (that’s all of us) just won’t put together a social support system that makes sure the next generation is ready and able.
Thank you Dr. Delavega for producing these charts each year.