The number of housing units in Shelby County has increased 1.9% between 2010 and 2016, and as of July 2016, there are 406,022 units. The change between 2015 and 2016 was 0.4%.
Increases since 2010 in other major Tennessee counties are 7.8% in Nashville/Davidson County; 4.3% in Hamilton County (Chattanooga); 3.4% in Knox County (Knoxville); 2.4% in Madison County (Jackson), 14.5% in Williamson County (Franklin and Brentwood); 5.7% in Sumner County (Hendersonville), and 12.8% in Montgomery County (Clarksville).
Here are the housing unit totals for Shelby County, according to U.S. Census Bureau:
2016 – 406,022
2015 – 404,281
2014 – 403,351
2013 – 401,784
2012 – 400,076
2011 – 399,281
2010 – 398,361
Meanwhile, The Joint Center for Housing Studies of Harvard University answers the question: Who can afford the median-priced home in their metro?
Here are the Memphis Metro numbers:
67.8% of all households can afford the median home price
49.8% of renter households can afford median home price
$145,200 – Median price of single-family house
$890 – Monthly payment on median-priced house
$48,520 – Median household income
$30,390 – Median household income of renters
The percentage of Memphis metro households that can afford median priced house is higher in Memphis than Nashville (64.4%), Seattle (48.6%), Portland (63.5%), San Antonio (63.6%), Austin (59.0%), Jacksonville (62.8%), Raleigh (62.6%), Salt Lake City (59.7%), and Birmingham (62.5%).
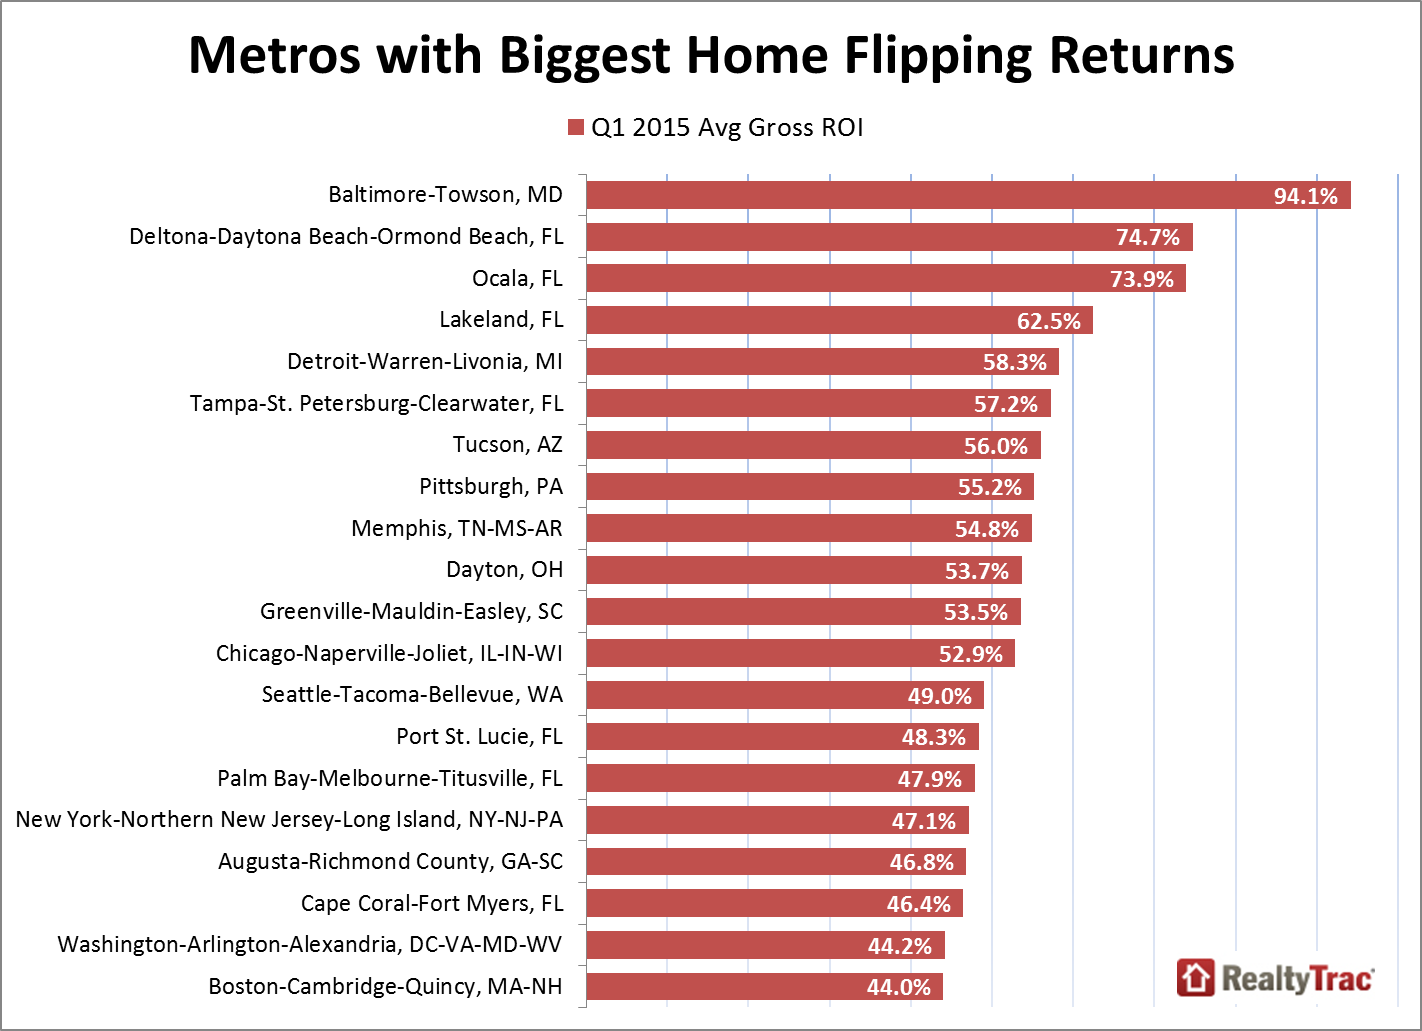
The percentage of Memphis metro households who can afford a median priced house is lower than Atlanta (70.7%), Detroit (72.0%), Pittsburgh (73.6%), Indianapolis (71.6%), Oklahoma City (70.9%), and Little Rock (71.0%).
Notes: Median home price is for existing single-family homes only. Monthly payment assumes a 5% down payment on the median-priced existing home with property taxes of 1.25%, property insurance of 0.25%, and mortgage insurance of 0.5%. “Affordable” means payments cannot exceed 36% of monthly household income (calculated as 1/12 of annual household income) and assumes household can finance down payment and other related home purchase costs.
Sources: House price and household income are from 2015. Median home price derived from National Association of Realtors© and Moody’s Analytics Forecasts. Household income derived from 2015 American Community Survey 1-Year estimates.
***
Join us at the Smart City Memphis Facebook page for daily articles, reports, and commentaries relevant to Memphis.


I wonder to what extent single family zoning limits housing supply and thus increases housing costs.
How about a breakdown of WHERE in Shelby county the new single family housing starts have been locating?