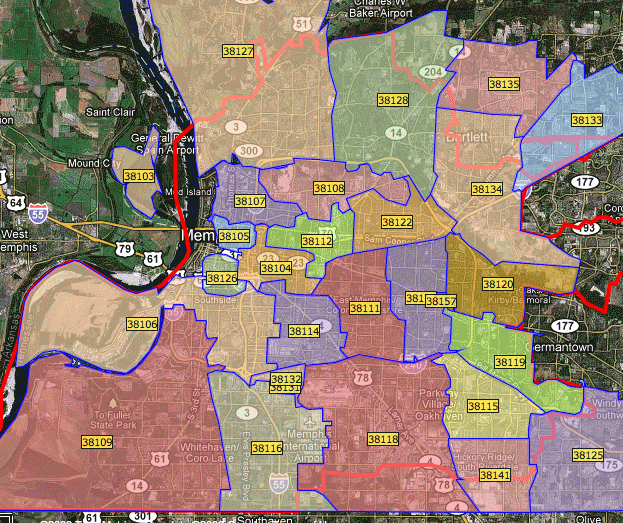
The map above is to indicate zip code boundaries and is not connected to the data points below. 38103 is not shown but it is downtown Memphis.
Here’s the sobering challenge facing Memphis and Shelby County (and the reason why the Blueprint for Prosperity and other poverty reduction plans are so crucial): 70% of Americans raised at the bottom never reach the middle.
The following are the percentages of the population below poverty in selected zip codes:
Percentages – Total Population – All Races
Highest
60.9% – Zip Code 38126
50.6% – Zip Code 38105
44.0% – Zip Code 38127
42.4% – Zip Code 38108
37.3% – Zip Code 38114
31.7% – Zip Code 38122
Lowest
2.4% – Zip Code 38139
3.9% – Zip Code 38017
4.4% – Zip Code 38002
4.8% – Zip Code 38135
5.3% – Zip Code 38119
5.9% – Zip Code 38016
Other
8.6% – Zip Code 38120
12.4% – Zip Code 38117
14.3% – Zip Code 38103
23.8% – Zip Code 38104
30.3% – Zip Code 38111
Percentages – Population under 5 years old – All Races
73.8% – Zip Code 38126
67.3% – Zip Code 38127
63.1% – Zip Code 38105
57.8% – Zip Code 38108
Percentages – Population 5 years old – All Races
93.1% – Zip Code 38126
85.6% – Zip Code 38112
82.0% – Zip Code 38127
69.4% – Zip Code 381114
Percentages – Population 6 to 11 years – All Races
79.6% – Zip Code 38126
65.6% – Zip Code 38127
64.2% – Zip Code 38105
59.0% – Zip Code 38108
58.1% – Zip Code 38106
Percentages – Population 12 to 17 years – All Races
74.0% – Zip Code 38105
65.3% – Zip Code 38126
63.4% – Zip Code 38106
62.8% – Zip Code 38108
62.3% – Zip Code 38107
Zip Codes – Highest Percentage by Race
White – Not Hispanic or Latino
37.9% – Zip Code 38126
26.1% – Zip Code 38127
African American
61.9% – Zip Code 38126
53.5% – Zip Code 38105
Hispanic or Latino
66.3% – Zip Code 38109
58.1% – Zip Code 38104

Memohis is truly a very poverty stricken city. No matter where you look on that map it’s shocking and sad that so many in our city are so poor.
Where’s the key to the map?
Scott: The map is to show boundaries of the zip codes in case people don’t know where they were located. The map is not keyed to the data points.
The numbers remind me of the first book I read on poverty: The Other America by Michael Harrington in 1962 or 1963. We have made sure that people don’t starve as easily as they did a half century ago, but our commitment to end poverty has been weak since the end of the 1960s. Like Harrington’s book, most people still live in a world where you either see a lot of poverty or hardly any at all. A half century ago, we believed it was about granting an ‘equal opportunity’ to everyone. Today, it might be argued that it is really about income distribution.
Really good point, David, and lays out the challenge to cities like ours.
It would be interesting to see how many of the families in poverty in Memphis are multi-generational residents of Memphis or more recent arrivals from elsewhere in the Delta.
Where did you get the zip code map?
The Commercial Appeal.